| Filed by the Registrant [X] | ||||
| Filed by a Party other than the Registrant [ ] | ||||
| Check the appropriate box: | ||||
| [ ] | Preliminary Proxy Statement | |||
| [ ] | Confidential, Commission Only (as permitted by Rule 14a-6(e)(2)) | |||
| [X] | Definitive Proxy Statement | |||
| [ ] | Definitive Additional Materials | |||
| [ ] | Soliciting Material Pursuant to §240.14a-12 | |||
| (Name of Registrant as Specified In Its Charter) | ||
| (Name of Person(s) Filing Proxy Statement, if |
| Payment of Filing Fee (Check the appropriate box): | ||||
| [X] | No fee required. | |||
| [ ] | Fee computed on table below per Exchange Act Rules 14a-6(i) | |||
| 1) | Title of each class of securities to which transaction applies: | |||
| 2) | Aggregate number of securities to which transaction applies: | |||
| 3) | Per unit price or other underlying value of transaction computed pursuant to Exchange Act Rule 0-11 (set forth the amount on which the filing fee is calculated and state how it was determined): | |||
| 4) | Proposed maximum aggregate value of transaction: | |||
| 5) | Total fee paid: | |||
| [ ] | Fee paid previously with preliminary | |||
| [ ] | Check box if any part of the fee is offset as provided by Exchange Act Rule 0-11(a)(2) and identify the filing for which the offsetting fee was paid previously. Identify the previous filing by registration statement number, or the | |||
| 1) | Amount | |||
| 2) | Form, Schedule or Registration Statement No.: | |||
| 3) | Filing Party: | |||
| 4) | Date Filed: | |||
__________
NOTICEOF ANNUALMEETINGOF SHAREHOLDERS
PROXY STATEMENT
AND
2013 ANNUAL REPORT__________
![]()


Fellow Shareholders:
Kroger achieved another outstanding year of performance for shareholders in 2013.
We are a company with many strengths, among them:
Our Company’s most enduring strength is our people — ourmore than 375,000 associates who strive to make every customer’s day a little better each time they visit one of our stores.
Our foundational approach is called Customer 1st. It simply means that the needs and wants of our customers are at the heart of every decision we make—in our stores, plants, offices, and facilities. It is our associates who bring Customer 1stto life. From product and technology innovation to improvements in the shopping experience, we are inspired by the ever-changing needs and wants of customers.Our greatest strategic advantage is our Customer 1st culture.
We are proud to be both large and small. As one of the world’s largest retailers, we leverage economies of scale in ways that make a difference for our customers in their daily lives. For example, we implemented an innovative, faster checkout approach that saves minutes for each customer every time they shop. We also leverage our size to offer great value on everyday items and weekly specials, and then provide a personalized mobile app—one of the most popular in that crowded space—that highlights the deals that match each shopper’s list.
In this letter, I will provide more detail behind our outstanding results in 2013 and explain the basis of our firm conviction thatthere is much more to come for shareholders, associates and customers.
Fiscal 2013 Results – Delivering Growth That Investors Can Count On
At our October 2012 investor meeting, we announcedaggressive growth plans that expand our Customer 1st Strategy by accelerating growth in our core business and improving our connection with all customers, expanding our presence in new and existing markets, and investing to create unique competitive positioning for today and the future. As a result, we expect to achieve a long-term, net-earnings-per-diluted-share growth rate of 8-11% and an increasing dividend over time.
We committed to fourkey performance indicators to measure our progress at that meeting as well:
In 2013, the first full fiscal year executing our aggressive growth plan, Kroger delivered on all four indicators. We achieved an unparalleled 41st consecutive quarter of positive identical supermarket sales; expanded FIFO operating margin on a rolling four quarters and adjusted basis, excluding fuel; improved return on invested capital, even as we increased capital investments; and grew market share for the ninth consecutive year.
Kroger’sconsistent and reliable performance delivers long-termgrowth investors can count on. And 2013 was another year of steady growth. Total sales were $98.4 billion in fiscal 2013, an increase of 3.9% after adjusting for the 53rd week in fiscal 2012. Net earnings were $1.52 billion, or $2.90 per diluted share. On an adjusted basis, net earnings grew 13 percent over last year’s adjusted amount. We continue to lower Kroger’s costs of doing business – achieving our ninth consecutive year of reducing operating expenses as a rate of sales – and to reinvest these savings in lower prices for our customers.
1
We are using free cash flow to reward shareholders. Since January 2000, Kroger has returned nearly $10 billion to shareholders through share repurchases. Since 2006, Kroger has paid nearly $1.9 billion in dividends to shareholders, while maintaining our investment-grade credit rating. In 2013, we increased our annual dividend for the seventh consecutive year and returned more than $928 million to shareholders through dividends and stock buybacks. If you had invested $100 in Kroger stock on January 31, 2000, and reinvested all dividends issued, your investment would have been worth $235 on January 31, 2014, and Kroger’s Total Shareholder Return in that same period is 125.8%. In March 2014, Kroger’s Board of Directors approved a $1 billion share repurchase program, underscoring our commitment to deliver cash to shareholders.
Welcoming Harris Teeter to the Kroger family
One of our platforms for growth is expanding into new markets. We are proud and excited towarmly welcome Harris Teeter to the Kroger family of stores. We completed our merger in January 2014 and integration is well underway. This exceptional 54-year-old regional chain receives very high marks from their customers for service, selection, meal-time solutions, and freshness. The 230 Harris Teeter stores are located in the highly attractive mid-Atlantic markets and expand Kroger’s national footprint. We have long respected the Harris Teeter management team and their operations, and we look forward to bringing the best of Harris Teeter and Kroger to our customers and shareholders.
Deeply loyal customers, creating strong market share
We have the privilege of servingeight million customers each day. Every one of them has unique interests and comes to our stores with the belief we will both meet their needs – their tastes, budget, and lifestyle –and delight them with the unexpected.
We continue to create innovative ways that allow us to know our customers better than anyone else and to personalize their experience with us. We’ve been mining “big data” for a long time, always with the single focus on Customer 1st – bringing to each customer what is most relevant to them.
We have invested in price every year for ten consecutive years, saving our customers more than $3 billion annually in the process.
We have rewarded customers with fuel savings through our popular fuel rewards program at more than 1,240 convenient supermarket fuel center locations in 2013. And, customers with a Kroger Rewards Visa credit card earned more than $33 million in free groceries last year.
We have partnered with customers to support the community organizations they care about most, returning $46 million annually to local organizations that customers select through our Community Rewards program.
Our approach has resulted in growing both market share and share of loyalty.
And we are not done!
Customer 1st innovationis giving us new and varied ways of connecting with and deepening our relationship with our customers.We are growing our digital offering to deliver value to our customers through the communication channels they prefer, and customers are responding. In fact, our customers have downloaded more than 1 billion digital coupons since we began offering them in late 2009.
We are innovating up and down our supply chain so that Kroger milk stays fresher, longer in customers’ refrigerators. Through process improvements, our dairy suppliers, milk plants, logistics operation, and stores worked together so that we can promise our customers thatKroger’s milk is among the freshest in the industry.
And we continue to build ourbest-in-class Corporate Brands portfolio by providing choices to our customers through a multi-tier offering of price points and product experiences. We expectSimple Truth andSimple Truth Organic to join our premium tier,Private Selection, as a “Billion Dollar Brand” by the end of fiscal 2014 as those brands are increasingly sought by shoppers focused on natural and organic foods. OurBanner Brandcontinues to provide great quality with a wide breadth of products, and ourValue brand offers customers the choice of quality products that are priced to fit their budget.
2
The Kroger Difference
Kroger’s culture and deeply-rooted values are also reflected in how we serve our friends and neighbors in local communities, and how we take care of each other.
We strive to be connected to and responsive to the local communities we serve by:
Let’s remember that we make these investments because our customers tell us these causes are important to them, and because they strengthen the communities we call home. When you combine the cash, food and product we donate to a variety of causes and programs,Kroger contributed more than $250 million to our local communities in 2013.
We also make a difference in the lives of our associates, customers and communities through our commitments to safety, sustainability, supplier diversity and job growth.
Kroger isone of the safest companies in our industry. Associate engagement in innovative safety programs has reduced accident rates in our stores and manufacturing plants by 77 percent since 1995. In 2013, 831 retail locations, three manufacturing plants, and three distribution centers went the entire year without a recordable accident.
One of Kroger’s key sustainability priorities is moving our retail stores and facilities toward “zero waste”. Our stores are sending less waste to landfills and incinerators through a variety of efforts, including composting and our innovativePerishable Donations Program – a process to rescue safe, edible fresh products and donate them quickly to local food banks. This system has been replicated by other retailers and today fresh products make up more than half of the food distributed nationwide by Feeding America. Our manufacturing facilities continue to lead waste reduction. Today,26 of our 38 manufacturing plants are designated as “zero waste” facilities.
You can learn more about our sustainability initiatives by reading our annual sustainability report, available on our website sustainability.kroger.com.
Kroger is aleader in supplier diversity, spending nearly $2 billion annually with women- and minority-owned businesses. We proudly remain a member of the Billion Dollar Roundtable and the United States Hispanic Chamber of Commerce Million Dollar Club.
Kroger isdoing our part to create jobs and opportunity. We employ 7,000 more associates today than we did last year, and nearly 90 percent of those new jobs are in our supermarket divisions. Over the last six years, Kroger has created more than 40,000 new jobs in the local communities we serve.
3
Leadership
We believe we have one of the strongest management teams in the retail industry. For ten years our Company has been led by Dave Dillon, who has been called “the grocers’ grocer.” Dave’s knowledge of the business, passion for customers and associates, and principled and disciplined approach to running a world-class company has rewarded shareholders, associates, customers, and communities. We thank him for the strong foundation he built and that we are inspired to continue to expand. Dave often refers to retailing as a team sport. Every great team, including ours, needs a great coach and leader. Thank you, Dave, for ten remarkable years as Chairman and CEO.
In Memoriam and Retirements
We were saddened by the loss of our friend and colleague, Jon C. Flora, who passed away unexpectedly in September 2013. He was president of Fry’s Food Stores in Arizona. Jon was a compassionate and hands-on leader. We all miss him deeply.
We extend our appreciation to John LaMacchia, who retired from Kroger’s Board of Directors in December 2013 after 24 years of service; to Paul Heldman, executive vice president, secretary and general counsel, who retires in May after 32 years of service; and to Robert “Pete” Williams, senior vice president, who retires in May after 37 years with the Company. On behalf of our entire Company, we thank each of these individuals for their service and leadership.
Bright Future – More to Come
Kroger’s future is bright. We are differentiating our Company in the crowded field of retailers in ways that lead to sustainable, reliable growth. And there is a lot more to come for shareholders, associates and customers.
On behalf of the entire Kroger family, we thank you for your continued support and trust.
 |
4
Congratulations to the winners of The Kroger Co. Community Service Award for 2013:
2013 Community Service Award Winners
5
Notice of 2016 Annual Meeting of Shareholders
Cincinnati, Ohio, May 14, 2014Fellow Kroger Shareholders:
To All ShareholdersIt is our pleasure to invite you to join our Board of Directors, senior leadership, and other Kroger associates at The Kroger Co.:
You are invited to our annual meeting Annual Meeting of shareholders of The Kroger Co. which will be held at the MUSIC HALL BALLROOM, MUSIC HALL, 1241 Elm Street, Cincinnati, Ohio 45202, on June 26, 2014, at 11 a.m., eastern time, for the following purposes:Shareholders.
| When: | Thursday, June 23, 2016, at 11:00 a.m. eastern time. | ||
| Where: | School for Creative and Performing Arts | ||
| Corbett Theater | |||
| 108 W. Central Parkway | |||
| Cincinnati, OH 45202 | |||
| Items of Business: | 1. | To elect | |
| 2. | To | ||
| 3. | To | ||
| 4. | To | ||
| 5. | To transact | ||
| Who can Vote: | Holders of Kroger common shares at the close of business on the record date April 27, 2016 are entitled to notice of and to vote at the meeting. | ||
| How to Vote: | Your vote is important! Please vote your proxy in one of the following ways: | ||
| 1. | Via the internet, by visiting www.proxyvote.com. | ||
| 2. | By telephone, by calling the number on your proxy card, voting instruction form or notice. | ||
| 3. | By mail, by marking, signing, dating and mailing your proxy card if you requested printed materials, or your voting instruction form. No postage is required if mailed in the United States. | ||
| 4. | In person, by attending the meeting in Cincinnati. | ||
| Attending the Meeting: | Shareholders holding shares at the close of business on the record date, or their duly appointed proxies, may attend the meeting. If you plan to attend the meeting, you must bring either: (1) the notice of meeting that was separately mailed to you or (2) the top portion of your proxy card, either of which will be your admission ticket. | ||
| Webcast of the Meeting: | If you are unable to attend the meeting, you may listen to a live webcast of the meeting by visiting ir.kroger.com at 11:00 a.m. eastern time on June 23, 2016. | ||
Holders of common shares of recordWe appreciate your continued confidence in Kroger, and we look forward to seeing you at the close of business on April 29, 2014, will be entitled to notice of and to vote at the meeting.
Attendance
Only shareholders and persons holding proxies from shareholders may attend the meeting.If you are attending the meeting, please bring the notice of the meeting that was separately mailed to you or the top portion of your proxy card, either of which will serve as your admission ticket.
YOUR MANAGEMENT DESIRES TO HAVE A LARGE NUMBER OF SHAREHOLDERS REPRESENTED AT THE MEETING, IN PERSON OR BY PROXY. PLEASE VOTE YOUR PROXY ELECTRONICALLY VIA THE INTERNET OR BY TELEPHONE. IF YOU HAVE ELECTED TO RECEIVE PRINTED MATERIALS, YOU MAY SIGN AND DATE THE PROXY AND MAIL IT IN THE SELF-ADDRESSED ENVELOPE PROVIDED. NO POSTAGE IS REQUIRED IF MAILED WITHIN THE UNITED STATES.
If you are unable to attend the annual meeting, you may listen to a live webcast of the meeting, which will be accessible through our website, ir.kroger.com, at 11 a.m., eastern time.
| By | |
| Christine S. Wheatley, Secretary | |
| May 12, 2016 | |
| Cincinnati, Ohio |
6
Proxy Statement
Cincinnati, Ohio, May 14, 201412, 2016
This Combined Notice, Proxy StatementWe are providing this notice, proxy statement and Annual Report is being furnishedannual report to the shareholders of The Kroger Co. (“Kroger”) in connection with the solicitation of proxies by the Board of Directors for use at the Annual Meeting of Shareholders to be held on June 26, 2014,23, 2016, at 1111:00 a.m., eastern time, at the MUSIC HALL BALLROOM, MUSIC HALL, 1241 Elm Street,School for Creative and Performing Arts, Corbett Theater, 108 W. Central Parkway, Cincinnati, Ohio 45202, and at any adjournments thereof.
TheOur principal executive offices of The Kroger Co. are located at 1014 Vine Street, Cincinnati, Ohio 45202-1100. Our telephone number is 513-762-4000. This Proxy Statementnotice, proxy statement and Annual Report,annual report, and the accompanying proxy card were first furnished to shareholders on May 14, 2014.12, 2016.
Who can vote?
You can vote if as of the close of business on April 27, 2016, you were a shareholder of record of Kroger common shares.
Who is asking for my vote, and who pays for this proxy solicitation?
Your proxy is being solicited by theKroger’s Board of Directors of TheDirectors. Kroger Co., andis paying the cost of solicitation. We have hired D.F. King & Co., Inc., 48 Wall Street, New York, New York, a proxy solicitation firm to assist us in soliciting proxies and we will be borne by Kroger. pay them a fee estimated not to exceed $15,000.
We also will reimburse banks, brokers, nominees, and other fiduciaries for postage and reasonable expenses incurred by them in forwarding the proxy material to their principals. Kroger has retained D.F. King & Co., Inc., 48 Wall Street, New York, New York, to assist in the solicitationbeneficial owners of proxies and will pay that firm a fee estimated at present not to exceed $15,000. our common shares.
Proxies may be solicited personally, by telephone, electronically via the Internet, or by mail.
Who are the members of the Proxy Committee?
Robert D. Beyer, W. Rodney McMullen, and Ronald L. Sargent, all of whomKroger Directors, are Kroger directors, have been namedthe members of the Proxy Committee.Committee for our 2016 Annual Meeting.
How do I vote my proxy?
You can vote your proxy in one of the following ways:
| 1. | Via the internet,by visiting www.proxyvote.com. | |
| 2. | By telephone,by calling the number on your proxy card, voting instruction form, or notice. | |
| 3. | By mail,by marking, signing, dating and mailing your proxy card if you requested printed materials, or your voting instruction form. No postage is required if mailed in the United States. | |
| 4. | In person,by attending the meeting in Cincinnati. | |
What do I need to attend the meeting in person in Cincinnati?
If you plan to attend the meeting, you must bring either: (1) the notice of meeting that was separately mailed to you or (2) the top portion of your proxy card, either of which will be your admission ticket.
You must also bring valid photo identification, such as a driver’s license or passport.
Can I change or revoke my proxy?
The common shares represented by each proxy will be voted in the manner you specified unless your proxy is revoked before it is exercised. You may change or revoke your proxy by providing written notice to Kroger’s Secretary at 1014 Vine Street, Cincinnati, Ohio 45202-1100, in person at the meeting or by executing and sending us a subsequent proxy.
How many shares are outstanding?
As of the close of business on April 29, 2014,27, 2016, the record date, our outstanding voting securities consisted of 509,553,233953,786,557 common shares,shares.
1
How many votes per share?
Each common share outstanding on the holders of whichrecord date will be entitled to one vote per share aton each of the annual meeting. The shares represented by11 director nominees and one vote on each proxy will be voted unless the proxy is revoked before it is exercised. Revocation may be in writing to Kroger’s Secretary, or in person at the meeting, or by appointment of a subsequent proxy.other proposal. Shareholders may not cumulate votes in the election of directors.
What voting instructions can I provide?
You may instruct the proxies to vote “For” or “Against” each proposal. Or you may instruct the proxies to “Abstain” from voting.
What happens if proxy cards or voting instruction forms are returned without instructions?
If you are a registered shareholder and you return your proxy card without instructions, the Proxy Committee will vote in accordance with the recommendations of the Board of Directors.
If you hold shares in street name and do not provide your broker with specific voting instructions on proposals 1, 2, 3,4, 5, and 6 or 7, which are considered non-routine matters, your broker does not have the authority to vote on those proposals. This is generally referred to as a “broker non-vote.” Proposal 43, ratification of auditors, is considered a routine matter and, therefore, your broker may vote your shares according to your broker’s discretion.
The vote required, including the effect of broker non-votes and abstentions for each of the matters presented for shareholder vote, is set forth below.
ItemWhat are the voting requirements for each of the proposals?
Proposal No. 1, Election of Directors – An affirmative vote of the majority of the total number of votes cast “for”“For” or “against”“Against” a director nominee is required for the election of a director in an uncontested election. Accordingly, broker non-votes and abstentions will have no effect on this proposal.A majority of votes cast means that the number of shares voted “for”“For” a director nominee must exceed the number of votes “against”“Against” such director.
Item No. 2, Approval of 2014 Long-Term Incentive and Cash Bonus Plan –Approval by shareholders of the Plan requires the affirmative vote of the majority of shares entitled to vote on the matter. Accordingly, broker Broker non-votes and abstentions will have no effect on this proposal.
ItemProposal No. 3,2, Advisory Vote to Approve Executive Compensation – ApprovalAdvisory approval by shareholders of executive compensation requires the affirmative vote of the majority of shares entitled to vote onparticipating in the matter. Accordingly, brokervoting. Broker non-votes and abstentions will have no effect on this proposal.
ItemProposal No. 4, Selection3, Ratification of Independent Auditors – Ratification by shareholders of the selection of independent public accountants requires the affirmative vote of the majority of shares entitled to vote onparticipating in the matter. Accordingly, abstentionsvoting. Abstentions will have no effect on this proposal.
ItemProposal Nos. 4, 5, 6 and 6,7, Shareholder Proposals– The affirmative vote of athe majority of shares participating in the voting on a shareholder proposal is required for its adoption.such proposal to pass. Accordingly, broker non-votes and abstentions will have no effect on these proposals. Proxies will be voted AGAINSTagainst these proposals unless the Proxy Committee is otherwise instructed on a proxy properly executed and returned. Broker non-votes and abstentions will have no effect on these proposals.
7How does the Board of Directors recommend that I vote?
| Proposal | Board Recommendation | |
| Item No. 1, Election of Directors | FOR | |
| See pages 4-7 | ||
| Item No. 2, Advisory Vote to Approve Executive Compensation | FOR | |
| See page 49 | ||
| Item No. 3, Ratification of Independent Auditors | FOR | |
| See pages 54-55 | ||
| Item Nos. 4, 5, 6 and 7, Shareholder Proposals | AGAINST | |
| See pages 57-63 |
Under the rules adopted by the SEC, we are furnishing proxy materials to our shareholders primarily on the Internet. We believe that this process should expedite shareholders’ receipt of proxy materials, lower the cost of our annual meeting and help to conserve natural resources. On or about May 14, 2014, we mailed to each of our shareholders (other than those who previously requested electronic or paper delivery), a Notice of Internet Availability of Proxy Materials containing instructions on how to access and review the proxy materials on the Internet and instructions on how to vote your shares.
82
Kroger’s Corporate Governance Practices
Kroger is committed to strong corporate governance. We believe that strong governance builds trust and promotes the long-term interests of our shareholders. Highlights of our corporate governance practices include the following:
| ✓ | All director nominees are independent, except for the CEO. | ||
| ✓ | All five Board Committees are fully independent. | ||
| ✓ | Annual election of all directors. | ||
| ✓ | All directors are elected with a simple majority standard for all uncontested director elections, with cumulative voting available in contested director elections. | ||
| ✓ | Commitment to Board refreshment and diversity. | ||
| ✓ | Regular engagement with shareholders to understand their perspectives and concerns. | ||
| ✓ | Regular executive sessions of the independent directors, at board and committee level. | ||
| ✓ | Strong independent lead director with clearly defined roles and responsibilities. | ||
| ✓ | Annual Board and Committee self-assessments. | ||
| ✓ | Annual evaluation of the Chairman and CEO by the independent directors. | ||
| ✓ | High degree of Board interaction with management to ensure successful oversight and succession planning. | ||
| ✓ | Stock ownership guidelines align executive and director interests with those of shareholders. | ||
| ✓ | Prohibition on all hedging, short sales and pledging. | ||
| ✓ | No poison pill (shareholder rights plan). | ||
| ✓ | Shareholders have the right to call a special meeting. | ||
| ✓ | Robust code of ethics. | ||
| ✓ | Strong Board oversight of enterprise risk. |
3
Proposals to Shareholders
Item 1. Election of Directors(Item No. 1)
You are being asked to elect 11 director nominees for a one-year term. The Board of Directors as now authorized,recommends that you vote FOR the election of all director nominees.
As of the date of this proxy statement, the Kroger Board of Directors consists of thirteentwelve members. David B. Lewis will be retiring from the Board of Directors immediately prior to the 2016 annual meeting, in accordance with Kroger’s director retirement policy, and will not be standing for re-election. The number of directors will be reduced to eleven by the Board. All members are to benominees, if elected at the 2016 annual meeting, towill serve until the annual meeting in 2015,2017, or until their successors have been elected by the shareholders or by the Board of Directors pursuant to Kroger’s Regulations, and qualified.
Kroger’s Articles of Incorporation provide that the vote required for election of a director nominee by the shareholders, except in a contested election or when cumulative voting is in effect, will beis the affirmative vote of a majority of the votes cast for or against the election of a nominee.
The experience, qualifications, attributes, and skills that led the Corporate Governance Committee and the Board to conclude that the following individuals should serve as directors are set forth opposite each individual’s name. The committee memberships stated below are those in effect as of the date of this proxy statement. It is intended that, except to the extent that authority is withheld, proxiesExcept as noted, each nominee has been employed by the Proxy Committee will be votedhis or her present employer (or a subsidiary thereof) in an executive capacity for the electionat least five years.
Nominees for Directors for Terms of the following persons:Office Continuing until 2017
| Professional | Director | |||||
| Name | Occupation (1) | Age | Since | |||
Nominees for Director for Terms of Office | ||||||
Reuben V. Anderson | Mr. Anderson is a Senior Partner in the Jackson, Mississippi office of Phelps Dunbar, a regional law firm based in New Orleans. Prior to joining this law firm, he was a justice of the Supreme Court of Mississippi. Mr. Anderson is currently serving as the lead director of AT&T Inc., and during the past five years was a director of Trustmark Corporation. He is a member of the Corporate Governance and Public Responsibilities Committees. Mr. Anderson has extensive litigation experience, and he served as the first African-American Justice on the Mississippi Supreme Court. His knowledge and judgment gained through years of legal practice are of great value to the Board. In addition, as former Chairman of the Board of Trustees of Tougaloo College and a resident of Mississippi, he brings to the Board his insights into the African-American community and the southern region of the United States. Mr. Anderson has served on numerous board committees, including audit, public policy, finance, executive, and nominating committees. | 71 | 1991 | |||
Nora A. Aufreiter Age 56 Director Since 2014 Committees: | Ms. Aufreiter is a Director Emeritus of McKinsey & Company, a global management consulting firm. She retired in June 2014 after more than 27 years with McKinsey, most recently as a director and senior partner. During that time, she worked extensively in the U.S., Canada, and internationally with major retailers, financial institutions and other consumer-facing companies. Before joining McKinsey, Ms. Aufreiter spent three years in financial services working in corporate finance and investment banking. She is a member of the Board of Directors of The Bank of Nova Scotia, The Neiman Marcus Group, and Cadillac Fairview, one of North America’s largest owners, operators and developers of commercial real estate. Ms. Aufreiter also serves on the boards of St. Michael’s Hospital and the Canadian Opera Company, and is a member of the Dean’s Advisory Board for the Ivey Business School in Ontario, Canada. Ms. Aufreiter has over 30 years of broad business experience in a variety of retail sectors. Her vast experience in leading McKinsey’s North American Retail Practice, North American Branding service line and the Consumer Digital and Omnichannel service line is of particular value to the Board. She also brings to the Board valuable insight on commercial real estate. |
94
| Professional | Director | |||||
| Name | Occupation (1) | Age | Since | |||
Robert D. Beyer | Mr. Beyer is Chairman of Chaparal Investments LLC, a private investment firm and holding company that he founded in 2009. From 2005 to 2009, Mr. Beyer served as Chief Executive Officer of The TCW Group, Inc., a global investment management firm. From 2000 to 2005, he served as President and Chief Investment Officer of Trust Company of the West, the principal operating subsidiary of TCW. Mr. Beyer is a member of the Board of Directors of The Allstate Corporation and Leucadia National Corporation. He is chair of the Corporate Governance Committee, a member of the Financial Policy Committee, and our Lead Director. Mr. Beyer brings to Kroger his experience as CEO of TCW, a global investment management firm serving many of the largest institutional investors in the U.S. He has exceptional insight into Kroger’s financial strategy, and his experience qualifies him to serve as a member of the Financial Policy Committee. While at TCW, he also conceived and developed the firm’s risk management infrastructure, an experience that is useful to the Kroger Board in performing its risk management oversight functions. His abilities and service as a director were recognized by his peers, who selected Mr. Beyer as an Outstanding Director in 2008 as part of the Outstanding Directors Program of the Financial Times. His strong insights into corporate governance form the foundation of his leadership role as Lead Director on the Board. | 54 | 1999 | |||
David B. Dillon | Mr. Dillon was elected Chief Executive Officer in 2003 and Chairman of the Board of Kroger in 2004. Mr. Dillon retired as Chief Executive Officer at the end of calendar year 2013 and will continue to serve as Chairman of the Board until the end of calendar year 2014. Mr. Dillon served as President and Chief Operating Officer in 2000, as President in 1999, and as President and Chief Operating Officer from 1995 to 1999. Mr. Dillon was elected Executive Vice President of Kroger in 1990 and President of Dillon Companies, Inc. in 1986. He is a director of DIRECTV and Union Pacific Corporation, and during the past five years was a director of Convergys Corporation. Mr. Dillon brings to Kroger his extensive knowledge of the supermarket business, having over 38 years of experience with Kroger and Dillon Companies. In addition to his depth of knowledge of Kroger and the fiercely competitive industry in which Kroger operates, he has gained a wealth of experience by serving on audit, compensation, finance, and governance committees of other boards. | 63 | 1995 |
Robert D. Beyer, Age 56 Director Since 1999 Committees: | Mr. Beyer is Chairman of Chaparal Investments LLC, a private investment firm and holding company that he founded in 2009. From 2005 to 2009, Mr. Beyer served as Chief Executive Officer of The TCW Group, Inc., a global investment management firm. From 2000 to 2005, he served as President and Chief Investment Officer of Trust Company of the West, the principal operating subsidiary of TCW. Mr. Beyer is a member of the Board of Directors of The Allstate Corporation and Leucadia National Corporation. Mr. Beyer has decided not to seek re-election to Allstate’s board of directors at its annual meeting in May 2016, after ten years of service on its board. Mr. Beyer brings to Kroger his experience as CEO of TCW, a global investment management firm serving many of the largest institutional investors in the U.S. He has exceptional insight into Kroger’s financial strategy, and his experience qualifies him to serve as a member of the Board. While at TCW, he also conceived and developed the firm’s risk management infrastructure, an experience that is useful to Kroger’s Board in performing its risk management oversight functions. His abilities and service as a director were recognized by his peers, who selected Mr. Beyer as an Outstanding Director in 2008 as part of the Outstanding Directors Program of the Financial Times. His strong insights into corporate governance form the foundation of his leadership role as Lead Director on the Board. | |
Anne Gates Age 56 Director Since 2015 Committees: | Ms. Gates is President of MGA Entertainment, Inc., a privately-held developer, manufacturer and marketer of toy and entertainment products for children, a position she has held since 2014. Ms. Gates held roles of increasing responsibility with The Walt Disney Company from 1992-2012. Her roles included executive vice president, managing director and chief financial officer for Disney Consumer Products and senior vice president of operations, planning and analysis. Prior to joining Disney, Ms. Gates worked for PepsiCo and Bear Stearns. Ms. Gates has over 15 years of experience in the retail and consumer products industry. She brings to Kroger financial expertise gained while serving as President of MGA and CFO of a division of the Walt Disney Company. Ms. Gates has a broad business background in marketing, strategy and business development, including international business. Her expertise in toy and entertainment products is of particular value to the Board. Ms. Gates has been designated an Audit Committee financial expert. | |
Susan J. Kropf Age 67 Director Since 2007 Committees: | Ms. Kropf was President and Chief Operating Officer of Avon Products Inc., a manufacturer and marketer of beauty care products, from 2001 until her retirement in January 2007. She joined Avon in 1970 and, during her tenure at Avon, Ms. Kropf also served as Executive Vice President and Chief Operating Officer, Avon North America and Global Business Operations from 1998 to 2000 and President, Avon U.S. from 1997 to 1998. Ms. Kropf was a member of Avon’s Board of Directors from 1998 to 2006. She currently is a director of Avon Products Inc., Coach, Inc., and Sherwin Williams Company. In the past five years she also served as a director of MeadWestvaco Corporation. Ms. Kropf has unique and valuable consumer insight, having led a major, publicly-traded retailer of beauty and related consumer products. She has extensive experience in manufacturing, marketing, supply chain operations, customer service, and product development, all of which assist her in her role as a member of Kroger’s Board. Ms. Kropf has a strong financial background, and has significant boardroom experience through her service on the boards of various public companies, including experience serving on compensation, audit, and corporate governance committees. She was inducted into the YWCA Academy of Women Achievers. |
105
| Professional | Director | |||||
| Name | Occupation (1) | Age | Since | |||
Susan J. Kropf | Ms. Kropf was President and Chief Operating Officer of Avon Products Inc., a manufacturer and marketer of beauty care products, from 2001 until her retirement in January 2007. She joined Avon in 1970. Prior to her most recent assignment, Ms. Kropf had been Executive Vice President and Chief Operating Officer, Avon North America and Global Business Operations from 1998 to 2000. From 1997 to 1998 she was President, Avon U.S. Ms. Kropf was a member of Avon’s Board of Directors from 1998 to 2006. She currently is a member of the Board of Directors of Coach, Inc., MeadWestvaco Corporation, and Sherwin Williams Company. She is a member of the Audit and Financial Policy Committees. Ms. Kropf has gained a unique consumer insight, having led a major beauty care company. She has extensive experience in manufacturing, marketing, supply chain operations, customer service, and product development, all of which assist her in her role as a member of Kroger’s Board. Ms. Kropf has a strong financial background, and has served on compensation, audit, and corporate governance committees of other boards. She was inducted into the YWCA Academy of Women Achievers. | 65 | 2007 | |||
David B. Lewis | Mr. Lewis is a shareholder and director of Lewis & Munday, a Detroit based law firm with offices in Washington, D.C. and New York City. He is a director of H&R Block, Inc. and STERIS Corporation. He is a member of the Financial Policy Committee and vice chair of the Public Responsibilities Committee. In addition to his background as a practicing attorney and expertise in bond financing, Mr. Lewis brings to Kroger’s Board his financial expertise gained while earning his MBA in Finance as well as his service and leadership on Kroger’s audit committee and the board committees of other publicly traded companies. Mr. Lewis has served on the Board of Directors of Conrail, Inc., LG&E Energy Corp., M.A. Hanna, TRW, Inc., and Comerica, Inc. He is a former chairman of the National Association of Securities Professionals. | 69 | 2002 |
W. Rodney McMullen, Age 55 Director Since 2003 | Mr. McMullen was elected Chairman of the Board in January 2015 and Chief Executive Officer of Kroger in January 2014. Mr. McMullen served as Kroger’s President and Chief Operating Officer from August 2009 to December 2013. Prior to that role, Mr. McMullen was elected to various roles at Kroger including Vice Chairman in 2003, Executive Vice President in 1999 and Senior Vice President in 1997. Mr. McMullen is a director of Cincinnati Financial Corporation and VF Corporation. Mr. McMullen has broad experience in the supermarket business, having spent his career spanning over 37 years with Kroger. He has a strong financial background, having served as our CFO, and played a major role as architect of Kroger’s strategic plan. His service on the compensation, executive, and investment committees of Cincinnati Financial Corporation and the audit and nominating and governance committees of VF Corporation add depth to his extensive retail experience. | |
Jorge P. Montoya Age 69 Director Since 2007 Committees: | Mr. Montoya was President of The Procter & Gamble Company’s Global Snacks & Beverage division, and President of Procter & Gamble Latin America, from 1999 until his retirement in 2004. Prior to that, he was an Executive Vice President of Procter & Gamble, a provider of branded consumer packaged goods, from 1995 to 1999. Mr. Montoya is a director of The Gap, Inc. Mr. Montoya brings to Kroger’s Board over 30 years of leadership experience at a premier consumer products company. He has a deep knowledge of the Hispanic market, as well as consumer products and retail operations. Mr. Montoya has vast experience in marketing and general management, including international business. He was named among the 50 most important Hispanics in Business & Technology, inHispanic Engineer & Information Technology Magazine. | |
Clyde R. Moore Age 62 Director Since 1997 Committees: | Mr. Moore was the Chairman of First Service Networks, a national provider of facility and maintenance repair services, until his retirement in 2015. Prior to that he was Chairman and Chief Executive Officer of First Service Networks from 2000 to 2014. Mr. Moore has over 30 years of general management experience in public and private companies. He has sound experience as a corporate leader overseeing all aspects of a facilities management firm and numerous manufacturing companies. Mr. Moore’s expertise broadens the scope of the Board’s experience to provide oversight to Kroger’s facilities, digital and manufacturing businesses. | |
Susan M. Phillips Age 71 Director Since 2003 Committees: | Dr. Phillips is Professor Emeritus of Finance at The George Washington University School of Business. She joined The George Washington University School of Business as a Professor and Dean in 1998. Dr. Phillips retired from her position as Dean in 2010, and retired from her position as Professor the following year. She was a member of the Board of Governors of the Federal Reserve System from December 1991 through June 1998. Before her Federal Reserve appointment, Dr. Phillips served as Vice President for Finance and University Services and Professor of Finance in The College of Business Administration at the University of Iowa from 1987 through 1991. She is a director of CBOE Holdings, Inc., State Farm Mutual Automobile Insurance Company, State Farm Companies Foundation, the Chicago Board Options Exchange, and Agnes Scott College. Dr. Phillips also was a director of the National Futures Association and State Farm Life Insurance Company until early 2016. Dr. Phillips brings to the Board strong financial acumen, along with a deep understanding of, and involvement with, the relationship between corporations and the government. Her experience in academia brings a unique and diverse viewpoint to the Board’s deliberations. Dr. Phillips has been designated an Audit Committee financial expert. |
116
| Professional | Director | |||||
| Name | Occupation (1) | Age | Since | |||
W. Rodney McMullen | Mr. McMullen was elected Chief Executive Officer of Kroger in January 2014. Prior to this, he served as President and Chief Operating Officer from August 2009 to December 2013. Prior to that, Mr. McMullen was elected Vice Chairman in 2003, Executive Vice President in 1999, and Senior Vice President in 1997. Mr. McMullen is a director of Cincinnati Financial Corporation. Mr. McMullen has broad experience in the supermarket business, having spent his career spanning over 35 years with Kroger. He has a strong financial background, having served as our CFO, and played a major role as architect of Kroger’s strategic plan. His service on the compensation, executive, and investment committees of Cincinnati Financial Corporation adds depth to his extensive retail experience. | 53 | 2003 | |||
Jorge P. Montoya | Mr. Montoya was President of The Procter & Gamble Company’s Global Snacks & Beverage division, and President of Procter & Gamble Latin America, from 1999 until his retirement in 2004. Prior to that, he was an Executive Vice President of Procter & Gamble, a provider of branded consumer packaged goods, from 1995 to 1999. Mr. Montoya is a director of The Gap, Inc. He is chair of the Public Responsibilities Committee and a member of the Compensation Committee. Mr. Montoya brings to Kroger’s Board over 30 years of leadership experience at a premier consumer products company. He has a deep knowledge of the Hispanic market, as well as consumer products and retail operations. Mr. Montoya has vast experience in marketing and general management, including international business. He was named among the 50 most important Hispanics in Business & Technology, inHispanic Engineer & Information Technology Magazine. | 67 | 2007 | |||
Clyde R. Moore | Mr. Moore is the Chairman and Chief Executive Officer of First Service Networks, a national provider of facility and maintenance repair services. He is a director of First Service Networks. Mr. Moore is chair of the Compensation Committee and a member of the Corporate Governance Committee. Mr. Moore has over 25 years of general management experience in public and private companies. He has sound experience as a corporate leader overseeing all aspects of a facilities management firm and a manufacturing concern. Mr. Moore’s expertise broadens the scope of the Board’s experience to provide oversight to Kroger’s facilities and manufacturing businesses. | 60 | 1997 |
12
| Professional | Director | |||||
| Name | Occupation (1) | Age | Since | |||
Susan M. Phillips | Dr. Phillips is Professor Emeritus of Finance at The George Washington University School of Business. She joined that university as a Professor and Dean in 1998. She retired as Dean of the School of Business as of June 30, 2010, and as Professor the following year. She was a member of the Board of Governors of the Federal Reserve System from December 1991 through June 1998. Before her Federal Reserve appointment, Dr. Phillips served as Vice President for Finance and University Services and Professor of Finance in The College of Business Administration at the University of Iowa from 1987 through 1991. She is a director of CBOE Holdings, Inc., State Farm Mutual Automobile Insurance Company, State Farm Life Insurance Company, State Farm Companies Foundation, National Futures Association, the Chicago Board Options Exchange, and Agnes Scott College. Dr. Phillips also was a trustee of the Financial Accounting Foundation until the end of 2010. She is a member of the Audit and Compensation Committees. Dr. Phillips brings to the Board strong financial acumen, along with a deep understanding of, and involvement with, the relationship between corporations and the government. Her experience in academia brings a unique and diverse viewpoint to the deliberations of the Board. Dr. Phillips has been designated an Audit Committee financial expert. | 69 | 2003 | |||
Steven R. Rogel | Mr. Rogel was elected Chairman of the Board of Weyerhaeuser Company, a forest products company, in 1999 and was President and Chief Executive Officer and a director thereof from December 1997 to January 1, 2008 when he relinquished the role of President. He relinquished the CEO role in April of 2008 and retired as Chairman as of April 2009. Before that time Mr. Rogel was Chief Executive Officer, President and a director of Willamette Industries, Inc. He served as Chief Operating Officer of Willamette Industries, Inc. until October 1995 and, before that time, as an executive and group vice president for more than five years. Mr. Rogel is a director of Union Pacific Corporation and during the past five years was a director and non-executive Chairman of the Board of EnergySolutions, Inc. He is a member of the Corporate Governance and Financial Policy Committees. Mr. Rogel has extensive experience in management of large corporations at all levels. He brings to the Board a unique perspective, having led a national supplier of paper products prior to his retirement. Mr. Rogel previously served as Kroger’s Lead Director, and has served on compensation, finance, audit, and governance committees of other corporations. | 71 | 1999 | |||
James A. Runde | Mr. Runde is a special advisor and a former Vice Chairman of Morgan Stanley, a financial services provider, where he has been employed since 1974. He was a member of the Board of Directors of Burlington Resources Inc. prior to its acquisition by ConocoPhillips in 2006. Mr. Runde serves as a Trustee Emeritus of Marquette University and the Pierpont Morgan Library. He is a member of the Compensation Committee and chair of the Financial Policy Committee. Mr. Runde brings to Kroger’s Board a strong financial background, having led a major financial services provider. He has served on the compensation committee of a major corporation. | 67 | 2006 |
13
| Professional | Director | |||||
| Name | Occupation (1) | Age | Since | |||
Ronald L. Sargent | Mr. Sargent is Chairman and Chief Executive Officer of Staples, Inc., a consumer products retailer, where he has been employed since 1989. Prior to joining Staples, Mr. Sargent spent 10 years with Kroger in various positions. In addition to serving as a director of Staples, Mr. Sargent is a director of Five Below, Inc. During the past five years, he was a director of Mattel, Inc. and The Home Depot, Inc. Mr. Sargent is chair of the Audit Committee and a member of the Public Responsibilities Committee. Mr. Sargent has over 30 years of retail experience, first with Kroger and then with increasing levels of responsibility and leadership at Staples, Inc. His efforts helped carve out a new market niche for the international retailer that he leads. His understanding of retail operations and consumer insights are of particular value to the Board. Mr. Sargent has been designated an Audit Committee financial expert. | 58 | 2006 | |||
Bobby S. Shackouls | Until the merger of Burlington Resources Inc. and ConocoPhillips, which became effective in 2006, Mr. Shackouls was Chairman of the Board of Burlington Resources Inc., a natural resources business, since July 1997 and its President and Chief Executive Officer since December 1995. He had been a director of that company since 1995 and President and Chief Executive Officer of Burlington Resources Oil and Gas Company (formerly known as Meridian Oil Inc.), a wholly-owned subsidiary of Burlington Resources, since 1994. Mr. Shackouls is a director of Plains GP Holdings, L.P. and Oasis Petroleum Inc. During the past five years, Mr. Shackouls was a director of ConocoPhillips and PNGS GP LLC, the general partner of PAA Natural Gas Storage, L.P. Mr. Shackouls is a member of the Audit and Corporate Governance Committees. Mr. Shackouls previously served as Kroger’s Lead Director. Mr. Shackouls brings to the Board the critical thinking that comes with a chemical engineering background, as well as his experience leading a major natural resources company, coupled with his corporate governance expertise. | 63 | 1999 |
James A. Runde Age 69 Director Since 2006 Committees: | Mr. Runde is a special advisor and a former Vice Chairman of Morgan Stanley, a financial services provider, where he was employed from 1974 until his retirement in 2015. He was a member of the Mr. Runde brings to Kroger’s Board a strong financial background, having led a major financial services provider. He has served on the compensation committee of a major corporation. | |
Ronald L. Sargent Age 60 Director Since 2006 Committees: | Mr. Sargent is Chairman and Chief Executive Officer of Staples, Inc., a business products retailer, where he has been employed Mr. Sargent has over 35 years of retail experience, first with Kroger and then with increasing levels of responsibility and leadership at Staples, Inc. His efforts helped carve out a new market niche for the international retailer that he leads. His understanding of retail operations and consumer insights are of particular value to the Board. Mr. Sargent has been designated an Audit Committee financial expert. | |
Bobby S. Shackouls Age 65 Director Since 1999 Committees: | Mr. Shackouls was Chairman of the Board of Burlington Resources Inc., a natural resources business, from July 1997 until its merger with ConocoPhillips in 2006 and its President and Chief Executive Officer from December 1995 until 2006. Mr. Shackouls was also the President and Chief Executive Officer of Burlington Resources Oil and Gas Company (formerly known as Meridian Oil Inc.), a wholly-owned subsidiary of Burlington Resources, from 1994 to 1995. Mr. Shackouls is a director of Plains GP Holdings, L.P. and Oasis Petroleum Inc. During the past five years, Mr. Shackouls was a director of ConocoPhillips and PNGS GP LLC, the general partner of PAA Natural Gas Storage, L.P. Mr. Shackouls previously served as Kroger’s Lead Director. Mr. Shackouls brings to the Board the critical thinking that comes with a chemical engineering background, as well as his |
14The Board of Directors Recommends a VoteFor Each Director Nominee.
7
Information Concerning the Board of Directors
Committees of the Board Leadership Structure and Lead Independent Director
The Board is currently composed of Directorseleven independent non-employee directors and one management director, Mr. McMullen, the Chairman and CEO. Kroger has a number of standing committees including Audit, Compensationbalanced governance structure in which independent directors exercise meaningful and Corporate Governance. All standing committees are composed exclusively of independent directors. All Board committees have charters that can be found on our corporate website at ir.kroger.com undervigorous oversight.
In addition, as provided in theGuidelines on Issues of Corporate Governance.
The table below provides (the current membership“Guidelines”), the Board has designated one of ourthe independent directors on eachas Lead Director. The Lead Director works with the Chairman to share governance responsibilities, facilitate the development of the standing committeesKroger’s strategy and grow shareholder value. The Lead Director serves a variety of our Board of Directors.roles, consistent with current best practices, including:
| ● | ||||||||||
| ● | ||||||||||
| presiding at the executive sessions of independent directors and at all other meetings of the Boardat which the Chairman is not present; |
serving as the Board’s representative for any consultation and direct communication, following arequest, with major shareholders. The Lead Director carries out these responsibilities in numerous ways, including: | ||||||||||
| facilitating communication and collegiality among the Board; |
| ● | soliciting direct feedback from non-executive directors; | |||||||||
| overseeing the succession process, including site visits and meeting with a wide range of corporateand division management associates; | ||||||||||
| meeting with the CEO frequently to discuss strategy; |
| ● | ||||||||||
| discussing Company matters with other directors between meetings. |
During 2013,Unless otherwise determined by the Audit Committee met five times,Board, the Compensation Committee met four times, andchair of the Corporate Governance Committee met two times. The Auditis designated as the Lead Director. Robert Beyer, an independent director and the chair of the Corporate Governance Committee, reviews financial reportingis currently the Lead Director. Mr. Beyer is an effective Lead Director for Kroger due to, among other things, his independence, his deep strategic and accounting matters pursuantoperational understanding of Kroger obtained while serving as a Kroger director, his insight into corporate governance, his experience on the boards of other large publicly traded companies, and his commitment and engagement to carrying out the roles and responsibilities of the Lead Director.
With respect to the roles of Chairman and CEO, theGuidelines provide that the Board will determine when it is in the best interests of Kroger and our shareholders for the roles to be separated or combined, and the Board exercises its charter and selects our independent accountants. The Compensation Committee recommends for determination by the independent membersdiscretion as it deems appropriate in light of prevailing circumstances. Upon retirement of our former Chairman, David B. Dillon, on December 31, 2014, the Board determined that it is in the compensationbest interests of Kroger and our shareholders for one person to serve as the Chairman and CEO, as was the case from 2004 through 2013. The Board believes that this leadership structure improves the Board’s ability to focus on key policy and operational issues and helps the Company operate in the long-term interests of shareholders. Additionally, this structure provides an effective balance between strong Company leadership and appropriate safeguards and oversight by independent directors. The Board believes that the combination or separation of these positions should continue to be considered as part of the Chief Executive Officer, determinessuccession planning process, as was the compensationcase in 2003 and 2014 when the roles were separated.
8
The Board and each of Kroger’s other senior management,its committees conduct an annual self-evaluation to determine whether the Board is functioning effectively at each level. As part of this annual self-evaluation, the Board assesses whether the current leadership structure continues to be appropriate for Kroger and administers some ofits shareholders. TheGuidelines provide the flexibility for the Board to modify our incentive programs. Additional information on the Compensation Committee’s processes and procedures for consideration of executive compensation are addressedleadership structure in the future as appropriate. We believe that Kroger, like many U.S. companies, has been well-served by this flexible leadership structure.
Committees of the Board of Directors
To assist the Board in undertaking its responsibilities, and to allow deeper engagement in certain areas of company oversight, the Board has established five standing committees: Audit, Compensation, DiscussionCorporate Governance, Financial Policy and Analysis below. Public Responsibilities. All committees are composed exclusively of independent directors, as determined under the NYSE listing standards. The current charter of each Board committee is available on our website at ir.kroger.com under Corporate Governance – Committee Composition.
| Name of Committee, Number of Meetings, and Current Members | Committee Functions | |
Audit Committee Meetings in 2015:5 Members: | ●Oversees the Company’s financial reporting and accounting matters, including review of the Company’s financial statements and the audit thereof, the Company’s financial reporting and accounting process, and the Company’s systems of internal control over financial reporting ●Selects, evaluates and oversees the compensation and work of the independent registered public accounting firm and reviews its performance, qualifications, and independence ●Oversees and evaluates the Company’s internal audit function, including review of its audit plan, policies and procedures and significant findings ●Oversees risk assessment and risk management, including review of legal or regulatory matters that could have a significant effect on the Company ●Reviews and monitors the Company’s compliance programs, including the whistleblower program | |
Compensation Committee Meetings in 2015:5 Members: | ●Recommends for approval by the independent directors the compensation of the CEO, and determines the compensation of other senior management and directors ●Administers the Company’s executive compensation policies and programs, including determining grants of equity awards under the plans ●Has sole authority to retain and direct the committee’s compensation consultant ●Assists the full Board with senior management succession planning |
9
| Name of Committee, Number of Meetings, and Current Members | Committee Functions |
Corporate Governance Committee | ●Oversees the Company’s corporate governance policies and procedures ●Develops criteria for selecting and retaining directors and identifies and recommends qualified candidates to be director nominees ●Designates membership and chairs of Board committees ●Reviews the Board’s performance and director independence ●Reviews, along with the other independent directors, the performance of the CEO |
Financial Policy Committee | ●Reviews and recommends financial policies and practices ●Oversees management of the Company’s financial resources ●Reviews the Company’s annual financial plan, significant capital investments, plans for major acquisitions or sales, issuance of new common or preferred stock, dividend policy, creation of additional debt and other capital structure considerations including additional leverage or dilution in ownership ●Monitors the investment management of assets held in pension and profit sharing plans administered by the Company |
Public Responsibilities Committee | ●Reviews the Company’s policies and practices affecting its social and public responsibility as a corporate citizen, including: community relations, charitable giving, supplier diversity, sustainability, government relations, political action, consumer and media relations, food and pharmacy safety and the safety of customers and employees ●Reviews and examines the Company’s evaluation of and response to changing public expectations and public issues affecting the business |
Director Nominee Selection Process
The Corporate Governance Committee develops criteriais responsible for selecting and retaining members ofrecommending to the Board seeks out qualifieda slate of nominees for election at each annual meeting of shareholders. The Corporate Governance Committee recruits candidates for Board membership through its own efforts and through recommendations from other directors and shareholders. In addition, the Corporate Governance Committee has retained an independent search firm to assist in identifying and recruiting director candidates who meet the criteria established by the Corporate Governance Committee.
These criteria are:
| ● | Demonstrated ability in fields considered to be of value in the deliberation and long-term planningof the Board, including business management, public service, education, technology, law andgovernment; |
| ● | Highest standards of personal character and conduct; |
| ● | Willingness to fulfill the obligations of directors and to make the contribution of which he or she iscapable, including regular attendance and participation at Board and committee meetings, andpreparation for all meetings, including review of all meeting materials provided in advance of the meeting;and |
| ● | Ability to understand the perspectives of Kroger’s customers, taking into consideration the diversityof our customers, including regional and geographic differences. |
10
The Corporate Governance Committee considers racial, ethnic and gender diversity to be important elements in promoting full, open and balanced deliberations of issues presented to the Board. The Corporate Governance Committee considers director candidates that help the Board reflect the diversity of our shareholders, associates, customers and the communities in which we operate. Some consideration also is given to the geographic location of director candidates in order to provide a reasonable distribution of members from Kroger’s operating areas.
At least annually, the Corporate Governance Committee actively engages in Board succession planning. The Corporate Governance Committee takes into account the Board and reviewscommittee evaluations regarding the performancespecific backgrounds, skills, and experiences that would contribute to overall Board and committee effectiveness as well as the future needs of the Board and along withits committees in light of Kroger’s current and future business strategies and the other independent board members,skills and qualifications of directors who are expected to retire in the CEO.future.
Director NominationsCandidates Nominated by Shareholders
The Corporate Governance Committee will consider shareholder recommendations for nominees for membership on the Board of Directors. If shareholders wish to nominate a person or persons for election to the Board of Directors at our 20152017 annual meeting, written notice must be submitted to the Company’sKroger’s Secretary, and received at our executive offices, in accordance with Kroger’s Regulations, not later than January 14, 2015.March 28, 2017. Such notice should include the name, age, business address and residence address of such person, the principal occupation or employment of such person, the number of Kroger common shares of the Company owned of record or beneficially by such person and any other information relating to the person that would be required to be included in a proxy statement relating to the election of directors. The Secretary will forward the information to the Corporate Governance Committee for its consideration. The Corporate Governance Committee will use the same criteria in evaluating candidates submitted by shareholders as it uses in evaluating candidates identified by the Committee. These criteria are:
15
Racial, ethnic, and gender diversity is an important element in promoting full, open, and balanced deliberations of issues presented to the Board, and is considered by the Corporate Governance Committee. Some consideration also is given to the geographic location of director candidates in order to provide a reasonable distribution of members from the operating areas of the Company.
The Corporate Governance Committee, typically recruits candidates for Board membership through its own efforts and through suggestions from other directors and shareholders. The Committee on occasion has retained an outside search firm to assist in identifying and recruiting Board candidates who meet the criteria established by the Committee.as described above.
Corporate Governance Guidelines
The Board of Directors has adopted theGuidelines on Issues of Corporate Governance. TheseTheGuidelines, which include copies of the current charters for each of the Audit, Compensation, and Corporate Governance Committees, and the otherfive standing committees of the Board, of Directors, are available on our corporate website at ir.kroger.com.ir.kroger.com under Corporate Governance – Highlights. Shareholders may obtain a copy of theGuidelines by making a written request to Kroger’s Secretary at our executive offices.
Independence
The Board of Directors has determined that all of the non-employee directors with the exception of Messrs. Dillon and McMullen, have no material relationships with Kroger and, therefore, are independent for purposes of the New York Stock Exchange listing standards. The Board made its determination based on information furnished by all members regarding their relationships with Kroger and its management, and other relevant information. After reviewing the information, the Board determined that all of the non-employee directors were independent because (i) they all satisfied the independence standards set forth in Rule 10A-3because:
| ● | they all satisfied the criteria for independence set forth in Rule 303A.02 of the NYSE ListedCompany Manual, |
| ● | the value of |
| ● | none had any material relationships with Kroger except for those arising directly from theirperformance of services as a director for Kroger. |
In determining that Mr. Sargent is independent, the Board considered transactions during fiscal 2015 between Kroger and entities with whichStaples, Inc. (where Mr. Sargent is Chairman and CEO) and determined that the directors are affiliated, the valueamount of which fallsbusiness fell below the thresholds identifiedset by the New York Stock ExchangeNYSE listing standards,standards. The transactions involved the purchase of goods by Kroger in the ordinary course of business totaling approximately $12 million and (iv) none had any material relationships with us exceptrepresented less than 0.06% of Staples’ annual consolidated gross revenue. Kroger periodically employs a bidding process or negotiations following a benchmarking of costs of products from various vendors for those arising directlythe items purchased from their performanceStaples and awards the business based on the results of services as a director for Kroger.that process.
11
Audit Committee Expertise
The Board of Directors has determined that Anne Gates, Susan M. Phillips and Ronald L. Sargent, independent directors who are members of the Audit Committee, are “audit committee financial experts” as defined by applicable SEC regulations and that all members of the Audit Committee are “financially literate” as that term is used in the NYSE listing standards.standards and are independent in accordance with Rule 10A-3 of the Securities Exchange Act of 1934.
Code of Ethics
The Board of Directors has adoptedThe Kroger Co. Policy on Business Ethics, applicable to all officers, employees and members of the Board of Directors,directors, including Kroger’s principal executive, financial and accounting officers. ThePolicy is available on our corporate website at ir.kroger.com.ir.kroger.com under Corporate Governance – Highlights. Shareholders may also obtain a copy of thePolicy by making a written request to Kroger’s Secretary at our executive offices. We intend to satisfy the disclosure requirement regarding any amendment to, or a waiver from, a provision of thePolicy for our principal executive, financial and accounting officers by posting that information on our website at ir.kroger.com.
16
Communications with the Board
The Board has established two separate mechanisms for shareholders and interested parties to communicate with the Board. Any shareholder or interested party who has concerns regarding accounting, improper use of Kroger assets or ethical improprieties may report these concerns via the toll-free hotline (800-689-4609) or email address (helpline@kroger.com) established by the Board’s Audit Committee. The concerns are investigated by Kroger’s Vice President of Auditing and reported to the Audit Committee as deemed appropriate by the Vice President of Auditing.
Shareholders or interested parties also may communicate with the Board in writing directed to Kroger’s Secretary at our executive offices. The Secretary will consider the nature of the communication and determine whether to forward the communication to the chair of the Corporate Governance Committee. Communications relating to personnel issues or our ordinary business operations, or seeking to do business with us, will be forwarded to the business unit of Kroger that the Secretary deems appropriate. All other communications will be forwarded to the chair of the Corporate Governance Committee for further consideration. The chair of the Corporate Governance Committee will take such action as he or she deems appropriate, which may include referral to the full Corporate Governance Committee or the entire Board.
Attendance
The Board of Directors held sevenfive meetings in 2013.fiscal year 2015. During 2013,fiscal year 2015, all incumbent directors attended at least 75% of the aggregate number of meetings of the Board and committees on which that director served. Members of the Board are expected to use their best efforts to attend all annual meetings of shareholders. All fourteeneleven members then serving on the Board attended last year’s annual meeting.
Independent Compensation Consultants
The Compensation Committee directly engages a compensation consultant from Mercer Human Resource Consulting to advise the Compensation Committee in the design of compensation forKroger’s executive officers.compensation. In 2013,2015, Kroger paid that consultant $375,944$390,767 for work performed for the Compensation Committee. Kroger, on management’s recommendation, retained the parent and affiliated companies of Mercer Human Resource Consulting to provide other services for Kroger in 2013,2015, for which Kroger paid $4,743,100.$2,339,577. These other services primarily related to insurance claims (for which Kroger was reimbursed by insurance carriers as claims were adjusted), insurance brokerage and bonding commissions provided by Marsh USA Inc., and pension consulting.plan compliance and actuary services provided by Mercer Inc. Kroger also made payments to affiliated companies for insurance premiums that were collected by the affiliated companies on behalf of insurance carriers, but these amounts are not included in the totals referenced above, as the amounts were paid over to insurance carriers for services provided by those carriers.
12
Although neither the Compensation Committee nor the Board expressly approved the other services, after taking into consideration the NYSE’s independence standards and the SEC rules, the Compensation Committee determined that the consultant is independent and his work has not raised any conflict of interest because (a) hebecause:
| ● | the consultant was first engaged by the Compensation Committee before he became associatedwith Mercer; |
| ● | the consultant works exclusively for the Compensation Committee and not for our management; |
| ● | the consultant does not benefit from the other work that Mercer’s parent and affiliated companiesperform for Kroger; and |
| ● | neither the consultant nor the consultant’s team perform any other services for Kroger. |
The Compensation Committee before he became associated with Mercer; (b) he works exclusively for themay engage an additional compensation consultant from time to time as it deems advisable.
Compensation Committee Interlocks and not for our management; (c) he does not benefit from the other work that Mercer’s parent and affiliated companies perform for Kroger; and (d) neither the consultant nor the consultant’s team perform any other services on behalf of Kroger.Insider Participation
No member of the Compensation Committee was an officer or employee of the CompanyKroger during fiscal year 2013,2015, and no member of the Compensation Committee was formerly anis a former officer of the CompanyKroger or was a party to any disclosable related person transaction involving the Company.Kroger. During fiscal year 2013,2015, none of theour executive officers of the Company served on the board of directors or on the compensation committee of any other entity that has or had executive officers serving as a member of theKroger’s Board of Directors or Compensation Committee of the Company.Board.
17
Board Oversight of Enterprise Risk
While risk management is primarily the responsibility of Kroger’s management team, the Board of Directors is responsible for thestrategic planning and overall supervision of our risk management activities. The Board’s oversight of the material risks faced by Kroger occurs at both the full Board level and at the committee level.
The Board’s Audit Committee has oversight responsibility not only for financial reporting of Kroger’s major financial exposures and the steps management has taken to monitor and control those exposures, but also for the effectiveness of management’s processes that monitor and manage key business risks facing Kroger, as well as the major areas of risk exposure and management’s efforts to monitor and control that exposure. The Audit Committee also discusses with management its policies with respect to risk assessment and risk management.
Management, including Kroger’s Chief Ethics and Compliance Officer, provides regular updates throughout the year to the respective committees regarding the management of the risks they oversee, and each of these committees reports on risk to the full Board at each regular meeting of the Board.
In addition to the reports from the committees, the Board receives presentations throughout the year from various department and business unit leaders that include discussion of significant risks as necessary. At each Board meeting, the Chairman and the CEO addressaddresses matters of particular importance or concern, including any significant areas of risk that require Board attention. Additionally, through dedicated sessions focusing entirely on corporate strategy, the full Board reviews in detail Kroger’s short- and long-term strategies, including consideration of significant risks facing Kroger and their potential impact. The independent directors, in executive sessions led by the Lead Director, address matters of particular concern, including significant areas of risk, that warrant further discussion or consideration outside the presence of Kroger employees. At the committee level, reports are given by management subject matter experts to each committee on risks within the scope of their charters.
The Audit Committee has oversight responsibility not only for financial reporting of Kroger’s major financial exposures and the steps management has taken to monitor and control those exposures, but also for the effectiveness of management’s processes that monitor and manage key business risks facing Kroger, as well as the major areas of risk exposure and management’s efforts to monitor and control that exposure. The Audit Committee also discusses with management its policies with respect to risk assessment and risk management.
Management, including our Chief Ethics and Compliance Officer, provides regular updates throughout the year to the respective Board committees regarding management of the risks they oversee, and each of these committees reports on risk to the full Board at each regular meeting of the Board.
We believe that our approach to risk oversight, as described above, optimizes our ability to assess inter-relationships among the various risks, make informed cost-benefit decisions, and approach emerging risks in a proactive manner for Kroger. We also believe that our risk structure complements our current Board leadership structure, as it allows our independent directors, through the five fully independent Board committees, and in executive sessions of independent directors led by an independentthe Lead Director, to exercise effective oversight of the actions of management, led by Mr. McMullen as Chairman of the Board and CEO, in identifying risks and implementing effective risk management policies and controls.
Board Leadership Structure and Lead Director
Our Board is composed of eleven independent non-employee directors, and two management directors, Mr. Dillon, the Chairman of the Board and our former Chief Executive Officer, and Mr. McMullen, our Chief Executive Officer. In addition, as provided in ourGuidelines on Issues of Corporate Governance, the Board has designated one of the independent directors as Lead Director. The Board has established five standing committees — audit, compensation, corporate governance, financial policy, and public responsibilities. Each Board committee is composed solely of independent directors, each with a different independent director serving as committee chair. The mix of experienced independent and management directors that make up our Board, along with the independent role of our Lead Director and our independent Board committees, benefits Kroger and its shareholders.
The Board designates one of the independent directors as a Lead Director. The Lead Director serves a variety of roles, including reviewing and approving Board agendas, meeting materials and schedules to confirm the appropriate topics are reviewed and sufficient time is allocated to each; serving as liaison between the Chairman of the Board, management, and the non-management directors; presiding at the executive sessions of independent directors and at all other meetings of the Board of Directors at which the Chairman of the Board is not present; calling an executive session of independent directors at any time and serving as the Board’s representative for any consultation and direct communication, following a request, with major shareholders. Unless otherwise determined by the Board, the chair of the Corporate Governance Committee is designated as the Lead Director. Robert Beyer, an independent director and the chair of the Corporate Governance Committee, is currently our Lead Director. Mr. Beyer is an effective Lead Director for Kroger due to, among other things, his independence, his deep strategic and operational understanding of Kroger obtained while serving as a Kroger director, his insight into corporate governance and his experience on other boards.
1813
With respectCompensation Discussion and Analysis
Executive Summary
Named Executive Officers
This Compensation Discussion and Analysis provides a discussion and analysis of our compensation program for our named executive officers (“NEOs”). For the 2015 fiscal year ended January 30, 2016, the NEOs were:
| Name | Title | |
| W. Rodney McMullen | Chairman and Chief Executive Officer | |
| J. Michael Schlotman | Executive Vice President and Chief Financial Officer | |
| Michael J. Donnelly | Executive Vice President of Merchandising | |
| Christopher T. Hjelm | Executive Vice President and Chief Information Officer | |
| Frederick J. Morganthall II | Executive Vice President of Retail Operations |
Messrs. Schlotman, Donnelly, Hjelm and Morganthall were each promoted to the rolesposition of ChairmanExecutive Vice President effective September 1, 2015.
Executive Compensation in Context: Our Growth Plan, Financial Strategy and CEO,Fiscal Year 2015 Results
Kroger’s growth plan includes four key performance indicators: positive identical supermarket sales without fuel (“ID Sales”) growth, slightly expanding non-fuel first in, first out (“FIFO”) operating margin, growing return on invested capital (“ROIC”), and annual market share growth. In 2015, we met or exceeded our goals for each of these performance indicators:
| ● | ID Sales.ID Sales increased 5.0% from 2014. Through 2015, we have achieved 49 consecutivequarters of positive ID Sales growth. |
| ● | ROIC.Our ROIC for 2015 was 13.93%, compared to 13.76% for 2014, excluding Roundy’s (acquiredin December 2015). |
| ● | Non-Fuel FIFO Operating Margin.We exceeded our commitment to slightly expand FIFO operatingmargin, excluding fuel and Roundy’s on a rolling four quarters basis. |
| ● | Market Share.Our market share grew for an eleventh consecutive year. |
| Other highlights of the year include: | |
| ● | Net earnings per diluted share were $2.06. |
| ● | We exceeded our long-term, net earnings per diluted share growth rate of 8-11% in 2015. |
| ● | We reduced operating costs excluding fuel as a percentage of sales for the eleventh consecutive year. |
| Also during 2015, we met all of our objectives with regard to our financial strategy: | |
| ● | Maintain our current investment grade debt rating.Our net total debt to adjusted EBITDA ratiodecreased, even while investing approximately $870 million in our merger with Roundy’s late inthe year. |
| ● | Repurchase shares. In 2015, we repurchased $703 million in Kroger common shares. |
| ● | Fund the dividend. We returned $385 million to shareholders through our dividend in 2015, and weincreased our dividend for the ninth consecutive year since we reinstated our dividend in 2006. |
| ● | Increase capital investments. Our 2015 cash flow generation was strong, allowing us to make$3.3 billion in capital investments during the year, excluding mergers, acquisitions and purchases ofleased facilities. |
The compensation of our NEOs in 2015 reflects Kroger’s short-term and long-term goals and outcomes. Total compensation for the year is an indicator of how well Kroger performed compared to our business plan, reflecting how our compensation program responds to business challenges and the marketplace.
14
GuidelinesSummary of Key Compensation Practices
| What we do: | What we do not do: |
✓Align pay and performance ✓Significant share ownership guidelines of 5x salary for our CEO ✓Multiple performance metrics under our short- and long-term performance-based plans discourage excessive risk taking ✓Balance between short-term and long-term compensation discourages short-term risk taking at the expense of long-term results ✓Engagement of an independent compensation consultant ✓Robust clawback policy ✓Ban on hedging and pledging of Kroger securities ✓Limited perquisites | ×No employment contracts with executives ×No special severance or change of control programs applicable only to executive officers ×No gross-up payments were made to executives under Kroger plans ×No re-pricing or backdating of options ×No guaranteed salary increases or bonuses ×No payment of dividends or dividend equivalents until performance units are earned ×No single-trigger cash severance benefits upon a change in control |
provide that the Board will determine when it isSummary of Fixed and At-Risk Pay Elements
The fixed and at-risk pay elements of NEO compensation are reflected in the best interests of Krogerfollowing table and its shareholders for the roles to be separated or combined, and the Board exercises its discretion as it deems appropriate in light of prevailing circumstances. As part of the succession planning process, theGuidelines provide that upon the selection of a new Chief Executive Officer, the Board will determine whether a separation of the offices is appropriate.charts. The Board believes that the combination or separation of these positions should continue to be considered as part of the succession planning process, as was the case in 2003, and again in 2014, when the roles were separated.
Our Board and each of its committees conduct an annual evaluation to determine whether they are functioning effectively. As part of this annual self-evaluation, the Board assesses whether the current leadership structure continues to be appropriate for Kroger and its shareholders. OurGuidelines provide the flexibility for our Board to modify our leadership structureamounts used in the future as appropriate. We believe that Kroger, like many U.S. companies, has been well-served by this flexible leadership structure.charts are based on the amounts reported in the Summary Compensation Table for 2015, excluding the Change in Pension Value and Nonqualified Deferred Compensation Earnings column.
| Fixed | At-Risk | ||||
| ‹—————————— Annual ————— | ———————› | ‹—————— Long-Term ——————› | |||
| Pay | Base Salary | All Other | Annual Cash | Long-Term | Restricted Stock |
| Element | Compensation | Bonus | Cash Bonus and | and Stock Options | |
| Performance Units | (time-based | ||||
| (the “Long-Term | equity awards) | ||||
| Incentive Plan”) | |||||
Description | ●Fixed cash compensation ●Reviewed annually ●No automatic or guaranteed increases | ●Insurance premiums paid by the Company ●Dividends paid on unvested restricted stock ●Matching and automatic contributions to defined contribution benefit plans | ●Variable cash compensation ●Payout depends on actual performance against annually established goals | ●Variable compensation payable as long-term cash bonus and performance units ●3-year performance period ●Payout depends on actual performance against established goals | ●Stock options vest over 5 years ●Exercise price of stock options is closing price on day of grant ●Restricted stock vests over 3 or 5 years |
1915
| At-Risk | |||||
| ‹———————————— Annual ———— | ———————› | ‹—————— Long-Term ——————› | |||
Purpose | ●Provide a base level of cash compensation ●Recognize individual performance, scope of responsibility and | ●Provide benefits competitive with peers | ●Metrics and targets align with annual business goals ●Rewards and incentivizes approximately 13,000 Kroger employees, including NEOs, for annual performance on key financial and operational measures | ●Metrics and targets align with long-term business strategy ●Rewards and incentivizes approximately 160 key employees, including the NEOs, for long-term performance on key financial and operational measures ●Drives sustainable performance that ties to long-term value creation for shareholders | ●Retain executive talent ●Align the interests of executives with long-term shareholder value ●Provide direct alignment to stock price appreciation |
CEO
87% of CEO pay is At Risk | Average of Other NEOs 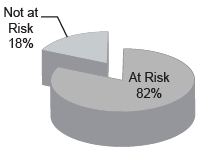 82% of Other NEO pay is At Risk | |
CEO
68% of CEO pay is Long-Term | Average of Other NEOs 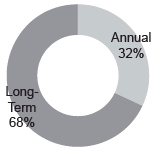 68% of Other NEO pay is Long-Term |
Executive16
CEO
60% of CEO pay is Equity | Average of Other NEOs
55% of Other NEO pay is Equity |
The following discussion and analysis addresses the compensation of the NEOs and the factors considered by the Compensation – OverviewCommittee in setting compensation for the NEOs and, in the case of the CEO’s compensation, making recommendations to the independent directors. Additional detail is provided in the compensation tables and the accompanying narrative disclosures that follow this discussion and analysis.
Our Compensation Philosophy and Objectives
As one of the largest retailers in the world, our executive compensation philosophy remainsis to attract and retain the best management talent and to motivate these employees to achieve our business and financial goals. Kroger’s incentive plans are designed to reward the actions that lead to long-term value creation. The Compensation Committee believes that there is a strong link between our business strategy, the performance metrics in our short-term and long-term incentive programs, and the business results that drive shareholder value.
We believe our strategy creates value for shareholders in a manner consistent with our focus on our core values: honesty, integrity, respect, inclusion, diversity and safety.
To achieve our objectives, ourthe Compensation Committee seeks to ensure that compensation is competitive and that there is a direct link between pay and performance. To do so, it is guided by the following principles:
The compensation of our senior executives in fiscal year 2013 reflects these principles. Total compensation for the year is an indicator of how well Kroger performed compared to our business plan, reflecting how our compensation program responds to business challenges and the marketplace. We continue to deliver sales growth and positive earnings results.
The Committee believes our management produced outstanding results in 2013, measured against increasingly aggressive business plan objectives for sales, earnings, and our strategic plan. The compensation paid to our named executive officers reflected this fact as the annual performance-based cash bonus paid out at 104.949% of bonus potentials. The strong link between pay and performance is illustrated by a comparison of the 2012 annual cash bonus, with an 85.881% payout. In 2012, we performed well but did not achieve all of our business plan objectives. In 2013, all of our business plan goals were exceeded (with the exception of our sales goal, which fell slightly short), resulting in an annual bonus payout that exceeded 100% of potentials.
In keeping with our overall compensation philosophy, we endeavor to ensure that our compensation practices conform to best practices. In particular, over the past several years we have:
| ● | A significant portion of pay should be performance-based, with the percentage of total pay tied to performance increasing proportionally with an executive’s level of responsibility. |
| ● | Compensation should include incentive-based pay to drive performance, providing superior pay for superior performance, including both a short- and long-term focus. |
| ● | Compensation policies should include an opportunity for, and a requirement of, equity ownership to align the interests of executives and shareholders. |
| ● | Components of compensation should be tied to an evaluation of business and individual performance measured against metrics that directly drive our business strategy. The Compensation Committee has three related objectives regarding compensation: |
| ● | First, the Compensation Committee believes that compensation must be designed to attract and retain those best suited to fulfill the challenging roles that officers play at Kroger. |
| ● | Second, a majority of compensation should help align the interests of our officers with the interests of our shareholders. |
| ● | Third, compensation should create strong incentives for the officers to achieve the annual business plan targets established by the Board, and to achieve Kroger’s long-term strategic objectives. |
2017
In addition, beginning in 2010, fifty percent of the time-based equity awards that otherwise would have been granted to the named executive officers as restricted stock have been replaced with performance units that are earned only to the extent that performance objectives are achieved. Equity compensation awards continue to play an important role in rewarding named executive officers for the achievement of long-term business objectives and providing incentives for the creation of shareholder value.
The following discussion and analysis addresses the compensation of the named executive officers, and the factors considered by the Committee in setting compensation for the named executive officers and making recommendations to the independent Board members in the case of the CEO’s compensation. Additional detail is provided in the compensation tables and the accompanying narrative disclosures that follow this discussion and analysis.
Executive Compensation – Objectives
The Committee has several related objectives regarding compensation. First, the Committee believes that compensation must be designed to attract and retain those best suited to fulfill the challenging roles that executive officers play at Kroger. Second, some elements of compensation should help align the interests of the officers with your interests as shareholders. Third, compensation should create strong incentives for the officers (a) to achieve the annual business plan targets established by the Board, and (b) to achieve Kroger’s long-term strategic objectives. In developing compensation programs and amounts to meet these objectives, the Committee exercises judgment to ensure that executive officer compensation is appropriate and competitive in light of Kroger’s performance and the needs of the business.
Share Ownership Guidelines
To more closely align the interests of the officers with your interests as shareholders, the Board of Directors has adopted stock ownership guidelines. These guidelines require non-employee directors, officers and some other key executives to acquire and hold a minimum dollar value of Kroger common shares. The guidelines require the CEO to acquire and maintain ownership of Kroger shares equal to five times his base salary; the Chief Operating Officer at four times his base salary; Executive Vice Presidents, Senior Vice Presidents and non-employee directors at three times their base salaries or annual base cash retainers; and other officers and key executives at two times their base salaries. Covered individuals are expected to achieve the target level within five years of appointment to their position. Kroger shares, including equity awards from Kroger, may not be sold by covered individuals prior to achieving holdings required by the guidelines (other than to pay for the exercise price of options and the taxes associated with equity awards), without the approval of Kroger’s CEO.
Results of 2013 Advisory Vote to Approve Executive Compensation
At the 2013 Annual Meeting of Shareholders, we held our third annual advisory vote on executive compensation. Over 97% of the votes cast were in favor of the advisory proposal in 2013. The Committee considered this overwhelmingly favorable outcome and believes it conveys our shareholders’ support of the Committee’s decisions and the existing executive compensation programs. As a result, the Committee made no material changes in the structure of our compensation programs or pay for performance philosophy. At the 2014 Annual Meeting of Shareholders, in keeping with our shareholders’ request for an annual advisory vote, we will again hold a vote to approve executive compensation (see page 55). The Committee will continue to consider the results from this year’s and future advisory votes on executive compensation.
Role of Compensation Committee
The Compensation Committee of the Board has the primary responsibility for establishing the compensation of Kroger’s executive officers, including the named executive officers, with the exception of the Chief Executive Officer. The Committee’s role regarding the CEO’s compensation is to make recommendations to the independent members of the Board; those independent Board members establish the CEO’s compensation.
21
Establishing Executive Compensation
The independent members of the Board have the exclusive authority to determine the amount of the CEO’s salary; the bonus potential for the CEO; the nature and amount of any equity awards made to the CEO; and any other compensation questions related to the CEO. In setting the annual bonus potential for the CEO, the independent directors determine the dollar amount that will be multiplied by the percentage payout under the annual bonus plan generally applicable to all corporate management, including the named executive officers. The independent directors retain discretion to reduce the percentage payout the CEO would otherwise receive. The independent directors thus make a separate determination annually concerning both the CEO’s bonus potential and the percentage of bonus paid.
The Committee performs the same function and exercises the same authority as to the other named executive officers. The Committee’s annual review of compensation for the named executive officers includes the following:
In considering each of the factors above, the Committee does not make use of a formula, but rather subjectively reviews each in setting compensation.
The Committee’s Compensation Consultants and Benchmarking
As referenced earlier in this compensation discussion and analysis, the Committee directly engages a compensation consultant from Mercer Human Resource Consulting to advise the Committee in the design of compensation for executive officers.
The Mercer consultant conducts an annual competitive assessment of executive positions at Kroger for the Committee. The assessment is one of several bases, as described above, on which the Committee determines compensation. The consultant assesses:
22
The consultant compares these elements against those of other companies in a group of publicly-traded food and drug retailers. For 2013, the group consisted of:
This peer group is the same group as was used in 2012. The make-up of the compensation peer group is reviewed annually and modified as circumstances warrant. Industry consolidation and other competitive forces will change the peer group used over time. The consultant also provides the Committee data from companies in “general industry,” a representation of major publicly-traded companies. These data are reference points, particularly for senior staff positions where competition for talent extends beyond the retail sector.
In 2009, the Committee directly engaged an additional compensation consultant to conduct a review of Kroger’s executive compensation. This consultant, from Frederic W. Cook & Co., Inc., examined the compensation philosophy, peer group composition, annual cash bonus, and long-term incentive compensation including equity awards. The consultant concluded that Kroger’s executive compensation program met the Committee’s objectives, and that it provides a strong linkage between pay and performance. The Committee expects to engage an additional compensation consultant from time to time as it deems advisable.
Considering the size of Kroger in relation to other peer group companies, the Committee believes that salaries paid to our executive officers should be at or above the median paid by competitors for comparable positions. The committee also aims to provide an annual bonus potential to our executive officers that, if the increasingly more challenging annual business plan objectives are achieved, would cause total cash compensation to be meaningfully above the median.
Components of Executive Compensation at Kroger
Compensation for our named executive officersNEOs is comprised of the following:
| ●Annual Compensation: | |
| ➢ | Salary |
| ➢ | Performance-Based Annual Cash Bonus |
| ●Long-Term Compensation: | |
| ➢ | Performance-Based Long-Term Incentive Plan (consisting of a long-term cash bonus andperformance units) |
| ➢ | Non-qualified stock options |
| ➢ | Restricted stock |
●Retirement and other benefits ● Limited perquisites | |
The annual and long-term performance-based compensation awards described herein were made pursuant to our 2011 Long-Term Incentive and Cash Bonus (annual, non-equity incentive pay);
Annual Compensation (long-term,– Salary
Our philosophy with respect to salary is to provide a sufficient and stable source of fixed cash compensation. All of our compensation cannot be at-risk or long-term. It is important to provide a meaningful annual salary to attract and performance unitincentive compensation);
Salary
We provide our named executive officers and other employees a fixed amountto have an appropriate level of cash compensation – salary – for their work. that is not variable.
Salaries for named executive officersthe NEOs (with the exception of the CEO) are established each year by the Compensation Committee, in consultation with the CEO. The CEO’s salary is established by the independent directors. Salaries for the named executive officers wereNEOs are reviewed annually in June 2013.June.
The amount of each executive’sNEO’s salary is influenced by numerous factors including:
| ● | An assessment of individual contribution in the judgment of the CEO and the CompensationCommittee (or, in the case of the CEO, of the Compensation Committee and the rest of theindependent directors); |
| ● | Benchmarking with comparable positions at peer group companies; |
| ● | Tenure in role; and |
| ● | Relationship to other Kroger executives’ salaries. |
23
The assessment of individual contribution is a qualitative determination, based on a subjective determination, without the use of performance targets, in the following areas:factors:
| ● | Leadership; |
| ● | Contribution to the officer group; |
| ● | Achievement of established objectives, to the extent applicable; |
| ● | Decision-making abilities; |
| ● | Performance of the areas or groups directly reporting to the officer; |
| ● | Increased responsibilities; |
| ● | Strategic thinking; and |
| ● | Furtherance of Kroger’s core values. |
18
The amounts shown below reflect the salaries of the named executive officers in effect followingNEOs effective at the annual reviewend of their compensation in June.each fiscal year.
| Salaries | |||||||||
| 2011 | 2012 | 2013 | |||||||
| David B. Dillon | $ | 1,290,000 | $ | 1,330,000 | $ | 1,370,000 | |||
| W. Rodney McMullen* | $ | 910,000 | $ | 939,600 | $ | 968,600 | |||
| J. Michael Schlotman | $ | 650,000 | $ | 671,100 | $ | 704,655 | |||
| Kathleen S. Barclay** | — | $ | 677,300 | $ | 700,000 | ||||
| Paul W. Heldman | $ | 739,000 | $ | 763,000 | $ | 786,000 | |||
| Michael L. Ellis*** | — | — | $ | 527,360 | |||||
| Salary | ||||||||
| 2013 | 2014 | 2015 | ||||||
| W. Rodney McMullen(1) | $ | 1,100,000 | $ | 1,200,000 | $ | 1,240,000 | ||
| J. Michael Schlotman(2) | $ | 735,000 | $ | 760,000 | $ | 840,000 | ||
| Michael J. Donnelly(2) | $ | 643,560 | $ | 662,900 | $ | 750,000 | ||
| Christopher T. Hjelm(2)(3) | $ | 700,000 | ||||||
| Frederick J. Morganthall II(2)(3) | $ | 670,000 | ||||||
| Mr. | ||
Annual Compensation – Performance-Based Annual Cash Bonus
A large percentageThe NEOs, along with approximately 13,000 of our employees at all levels, including the named executive officers, are eligible to receivetheir fellow Kroger associates, participate in a performance-based annual cash bonus plan. Approximately 7,000 of those associates are eligible for the same plan as the NEOs. The remaining associates are eligible for an annual cash bonus plan of which 40% is based on the performance of Kroger (incorporate plan and 60% is based on the casemetrics and targets for their respective supermarket division or operating unit of the named executive officers) orCompany.
Over time, the Compensation Committee and our independent directors have placed an increased emphasis on our strategic plan by making the targets more difficult to achieve. The annual cash bonus plan is structured to encourage high levels of performance. A threshold level of performance must be achieved before any payouts are earned, while a payout of up to 200% of target can be achieved for superior performance.
The amount of annual cash bonus that the NEOs earn each year is based upon Kroger’s performance compared to targets established by the Compensation Committee and the independent directors based on the business unit (inplan adopted by the caseBoard of employees inDirectors.
The annual cash bonus plan is designed to encourage decisions and behavior that drive the annual operating results and the long-term success of the Company. Kroger’s success is based on a combination of factors, and accordingly the Compensation Committee believes that it is important to encourage behavior that supports multiple elements of our business units). strategy.
Establishing Annual Cash Bonus Potentials
The Compensation Committee establishes annual cash bonus potentials for each executive officer,NEO, other than the CEO, whose annual cash bonus potential is established by the independent directors. Actual payouts, which can exceed 100% of the potential amounts but may not exceed 200% of the potential amounts, represent the extent to which performance meets or exceeds the thresholdsgoals established by the Compensation Committee. Actual payouts may be as low as zero if performance does not meet the goals established by the Compensation Committee.
The Compensation Committee considers severalmultiple factors in making its determination or recommendation as to annual cash bonus potentials. First, the individual’s level within the organization is a factor in that the Committee believes that more senior executives should have a substantial part of their compensation dependent upon Kroger’s performance. Second, the individual’s salary is a factor so that a substantial portion of a named executive officer’s total cash compensation is dependent upon Kroger’s performance. Finally, the Committee considers the reports of its compensation consultants to assess the bonus potential of the named executive officers in light of total compensation paid to comparable executive positions in the industry.potentials:
| ● | The individual’s level within the organization, as the Compensation Committee believes that moresenior executives should have a more substantial part of their compensation dependent uponKroger’s performance; |
| ● | The individual’s salary, as the Compensation Committee believes that a significant portion of aNEO’s total cash compensation should be dependent upon Kroger’s performance; |
2419
| ● | The officer’s level in the organization and the internal relationship of annual cash bonus potentialswithin Kroger; |
| ● | Individual performance; |
| ● | The recommendation of the CEO for all NEOs other than the CEO; and |
| ● | The compensation consultant’s benchmarking report regarding annual cash bonus potential andtotal compensation awarded by our peer group. |
��The annual cash bonus potential in effect followingat the annual reviewend of compensation in Junethe fiscal year for each named executive officerNEO is shown below. Actual annual cash bonus payouts are prorated to reflect changes, if any, to bonus potentials during the year.
| Annual Bonus Potential | |||||||||
| 2011 | 2012 | 2013 | |||||||
| David B. Dillon | $ | 1,500,000 | $ | 1,500,000 | $ | 1,500,000 | |||
| W. Rodney McMullen* | $ | 1,000,000 | $ | 1,000,000 | $ | 1,000,000 | |||
| J. Michael Schlotman | $ | 525,000 | $ | 550,000 | $ | 550,000 | |||
| Kathleen S. Barclay** | — | $ | 550,000 | $ | 550,000 | ||||
| Paul W. Heldman | $ | 550,000 | $ | 550,000 | $ | 550,000 | |||
| Michael L. Ellis*** | — | $ | — | $ | 375,000 | ||||
| Annual Cash Bonus Potential | ||||||||
| 2013 | 2014 | 2015 | ||||||
| W. Rodney McMullen(1) | $ | 1,500,000 | $ | 1,600,000 | $ | 1,650,000 | ||
| J. Michael Schlotman(2) | $ | 550,000 | $ | 550,000 | $ | 600,000 | ||
| Michael J. Donnelly(2) | $ | 425,000 | $ | 550,000 | $ | 600,000 | ||
| Christopher T. Hjelm(2)(3) | $ | 600,000 | ||||||
| Frederick J. Morganthall II(2)(3) | $ | 600,000 | ||||||
| Mr. | ||
Annual Cash Bonus Plan Metrics and Connection to our Business Plan
The annual cash bonus plan has the following measurable performance metrics, all of which are interconnected, and individually necessary to sustain our business model and achieve our growth strategy:
| Metric | Weight | Rationale for Use |
ID Sales | 30% | ●ID Sales represent sales, without fuel, at our supermarketsthat have been open without expansion or relocation for fivefull quarters. ●We believe this is the best measure of the real growth ofour sales across the enterprise. A key driver of our model isstrong ID Sales; it is the engine that fuels our growth. |
EBITDA without Fuel(1) | 30% | ●EBITDA is an important way for us to evaluate our earningsfrom operating the business; we cannot achieve solidEBITDA without a ●Unlike earnings per share, which can be affected bymanagement decisions on share buybacks, this measureof earnings is relevant for all of our approximately 13,000associates who are eligible for the annual cash bonus plan. |
20
| Metric | Weight | Rationale for Use |
Customer 1st Strategy | 30% | ●Kroger’s Customer 1stStrategy is the focus, in ●This proprietary metric measures the improvement in howKroger is perceived by customers in each of the Four Keys. ●Annual cash bonus payout is based on certain elements ofthe Customer 1stPlan, to highlight annual objectives that areintended to receive the most focused attention in that year. |
Total Operating Costs as a Percentage of Sales, without Fuel(2) | 10% | ●An essential part of Kroger’s model is to increaseproductivity and efficiency, and to take costs out of thebusiness in a sustainable way. ●We strive to be disciplined, so that as the Company grows,expenses are properly managed. |
Total of 4 Metrics | 100% | |
Fuel Bonus | 5% “Kicker” | ●An additional 5% is earned if Kroger achieves three goalswith respect to its supermarket fuel operations: targeted fuelEBITDA, an increase in total gallons sold, and additionalfuel centers placed in service. ●The fuel bonus ●The fuel bonus of 5% is only available if all three measuresare met. If any of the three fuel goals are not met, no portionof the fuel bonus is earned. |
| (1) | EBITDA is calculated as operating profit plus depreciation and amortization, excluding fuel and consolidated variable interest entities. | |
| (2) | Total Operating Costs is calculated as the sum of (i) operating, general and administrative expenses, depreciation and amortization, and rent expense, without fuel, and (ii) warehouse and transportation costs, shrink, and advertising expenses, for our supermarket operations, without fuel. | |
Over timeThe use of these four primary metrics creates checks and balances on the Committeevarious behaviors and decisions that impact the long-term success of the Company. The ID Sales, EBITDA without fuel and Customer 1st Strategy metrics are weighted equally to highlight the need to simultaneously achieve all three metrics in order to maintain our independent directorsgrowth.
We aligned the weighting of ID Sales and EBITDA without fuel metrics to emphasize sales growth balanced with the focus on profit. Kroger’s business is not sustainable if we merely increase our ID Sales, but do not have placed an increased emphasisa corresponding increase in earnings. Furthermore, payouts in the ID Sales and EBITDA without fuel segments are interrelated. Achieving the goal for both the ID Sales and EBITDA without fuel results in a higher percentage payout on our strategic plan by makingboth elements. Achieving the target more difficulton one, but not the other will limit the payout percentage on both.
By supporting the Customer 1st Strategy and the Four Keys, we will better connect with our customers. Our unique competitive advantage is our ability to achieve. The bonus plan allows for minimal bonusdeliver on the Four Keys, which are the items that matter most to be earned at relatively low levels of performance to provide incentive for achieving even higher levels of performance.our customers, and it is that multi-faceted achievement that we believe drives our ID Sales growth.
As we strive to achieve our aggressive growth targets, we also continuously aim to reduce our operating costs as a percentage of sales, without fuel. Productivity improvements and other reductions in operating costs allow us to reduce costs in areas that do not matter to our customers so that we can
21
invest money in the areas that matter the most to our customers, like the Four Keys. We carefully manage operating cost reductions to ensure a consistent delivery of the customer experience. This again shows the need to have multiple metrics, to create checks and balances on the various behavior and decisions that are influenced by the design of the bonus plan.
Results of 2015 Annual Cash Bonus Plan
The amount of bonus that the named executive officers earn each year is determined by Kroger’s performance compared to targets2015 goals established by the Compensation Committee, the actual 2015 results and our independent directors based on the business plan adopted by the Board of Directors. In 2013, one-thirdbonus percentage earned for each of the bonus was based on a target for identical sales without fuel; one-third was based on a target for EBITDA without fuel; and one-third was based on implementation and results of a set of measures under our strategic plan. An additional 5% would be earned if Kroger achieved three goals with respect to its supermarket fuel operations: achievementperformance metrics of the targeted fuel EBITDA, increase of at least 3% in total gallons sold,and achievement of the planned number of fuel centers placed in service.annual cash bonus plan were as follows:
| Actual | ||||||||||||
| Performance | ||||||||||||
| Goals | Compared to | Amount | ||||||||||
| Target | Actual | Target | Weight | Earned | ||||||||
| Performance Metrics | Minimum | (100%) | Performance(1) | (A) | (B) | (A) x (B) | ||||||
| ID Sales | 2.1% | 4.1% | 5.0% | 134.3% | 30% | 40.3% | ||||||
| EBITDA without Fuel | $4.4384 | $5.2217 | $5.2351 | |||||||||
| Billion | Billion | Billion | 126.3%(2) | 30% | 37.9% | |||||||
| Customer 1stStrategy(3) | * | * | * | * | 30% | 39.0% | ||||||
| Over | Over | Over | 45.0% | 10% | 4.5% | |||||||
| Total Operating Costs as | budget by | budget by | budget by | |||||||||
| Percentage of Sales, | 25 basis | 5 basis | 16 basis | |||||||||
| without Fuel(4) | points | points | points | |||||||||
| 0% | 5.0% | |||||||||||
| Fuel Bonus(5) | [As described in the footnote below] | or 5% | ||||||||||
| Total Earned | 126.7% | |||||||||||
| (1) | Actual performance results exclude Roundy’s because the merger occurred after the performance goals were established. | |
| (2) | Under the terms of the plan, if ID Sales results exceed the target and EBITDA results exceed the target, then the payout percentage for reaching the EBITDA target is 125% rather than 100%. | |
| (3) | The Customer 1stStrategy component also was established by the Compensation Committee at the beginning of the year, but is not disclosed as it is competitively sensitive. | |
| (4) | Total Operating Costs without fuel were budgeted at 26.07% as a percentage of sales for fiscal year 2015. | |
| (5) | An additional 5% is earned if Kroger achieves three goals with respect to its supermarket fuel operations: achievement of the targeted fuel EBITDA of $242 million, an increase in total gallons sold of 3%,and achievement of 50 additional fuel centers placed in service. Actual results were: fuel EBITDA of $450 million; an increase in total gallons sold of 8.53%; and 57 additional fuel centers placed in service. | |
Following the close of the year, the Compensation Committee reviewed Kroger’s performance against each of the identical sales without fuel, EBITDA without fuel, and strategic plan objectivesmetrics outlined above and determined the extent to which Kroger achieved those objectives.Kroger’s EBITDA without fuel for 2013 was $4.245 billion and Kroger’s identical sales without fuel for 2013 were 3.5%. In 2013, Kroger’s supermarket fuel EBITDA was $232.990 million, which exceeded the goal of $184.875 million necessary to earn a bonus for the fuel component. Kroger’s fuel gallon sales The Compensation Committee believes our management produced outstanding results in supermarket fuel centers were 4.431 billion gallons, or 6.6% over the prior year. We operated 1,240 supermarket fuel centers as of the end of 2013, exceeding our goal of 1,235 centers. As a result, the payout percentage included the additional 5% fuel bonus.2015, measured against increasingly aggressive business plan objectives. Due to our performance when compared to the targetsgoals established by the Compensation Committee, and based on the business plan adopted by the Board, of Directors, the named executive officers earned 104.949% of their bonus potentials. This is the same bonus percentage payout received byNEOs and all other participants in the corporate annual corporatecash bonus plan.plan earned 126.7% of their bonus potentials.
25
The 2013 targets established by the Committee for annual bonus amounts based on identical sales without fuel and EBITDA without fuel results, the actual 2013 results, and the bonus percentage earned in each of the components of named executive officer bonus, were as follows:
| Targets | ||||||||||||
| Component | Minimum | 100% | Result | Amount Earned | ||||||||
| Identical Sales without fuel | 1.6% | 3.6% | 3.5% | 31.679 | % | |||||||
| EBITDA without fuel | $3.583 Billion | $4.216 Billion* | $4.245 Billion | 34.474 | % | |||||||
| Strategic Plan | ** | ** | ** | 33.796 | % | |||||||
| Fuel Bonus | [as described in the text above] | 5.000 | % | |||||||||
| Total Earned | 104.949 | % | ||||||||||
In 2013,2015, as in all years, the Compensation Committee retained discretion to reduce the annual cash bonus payout for all executive officers, including the named executive officers,NEOs, if the Compensation Committee determined for any reason that the bonus payouts were not appropriate.appropriate given their assessment of Company performance. The independent directors retained that discretion for the CEO’s bonus. Those bodiesThe Compensation Committee and the independent directors also retained discretion to adjust the targets goals for each metric
22
under the plan should unanticipated developments arise during the year. No adjustments were made to the targetsgoals in 2013.2015. The Compensation Committee, and the independent directors in the case of the CEO, determined that the annual cash bonus payouts forearned appropriately reflected the named executive officersCompany’s strong performance in 2015 and therefore should remain the same as other participants.not be adjusted.
The actual annual cash bonus percentage paidpayout for 20132015 represented excellent performance that exceeded our business plan objectives. objectives, with the exception of operating costs as a percentage of sales, without fuel. The strong link between pay and performance is illustrated by a comparison of earned amounts under our annual cash bonus plan in previous years, such as 2009, 2010 and 2012, when payouts were less than 100%. In those years, we did not achieve all of our business plan objectives.A comparison of actual annual cash bonus percentages for the named executive officerspercentage payouts in prior years demonstrates the variability of annual cash bonus incentive compensation:compensation and its strong link to our performance:
| Annual Cash Bonus | Annual Cash Bonus | |||||||
| Fiscal Year | Percentage | Payout Percentage | ||||||
| 2015 | 126.7 | % | ||||||
| 2014 | 121.5 | % | ||||||
| 2013 | 104.949 | % | 104.9 | % | ||||
| 2012 | 85.881 | % | 85.9 | % | ||||
| 2011 | 138.666 | % | 138.7 | % | ||||
| 2010 | 53.868 | % | 53.9 | % | ||||
| 2009 | 38.450 | % | 38.5 | % | ||||
| 2008 | 104.948 | % | 104.9 | % | ||||
| 2007 | 128.104 | % | 128.1 | % | ||||
| 2006 | 141.118 | % | 141.1 | % | ||||
| 2005 | 132.094 | % | ||||||
| 2004 | 55.174 | % | ||||||
As described above, the annual cash bonus payout percentage is applied to each NEO’s bonus potential, which is determined by the Compensation Committee, and the independent directors in the case of the CEO. The actual amounts of performance-based annual performance-based cash bonuses paid to the named executive officersNEOs for 20132015 are reported in the Summary Compensation Table underin the heading “Non-Equity Incentive Plan Compensation” column and footnote 4. These amounts represent the bonus potentials for each named executive officer multiplied by the 104.949% payout percentage earned in 2013. In no event can any participant receive a performance-based annual cash bonus in excess of $5,000,000. The maximum amount4 to that a participant, including each named executive officer, can earn is further limited to 200% of the participant’s bonus potential amount.
The performance-based annual cash bonus for 2014 will be determined based on Kroger’s performance against the identical sales without fuel, EBITDA without fuel, strategic plan, and operating costs as a percentage of sales objectives established by the Committee. The first three metrics will be weighted at 30% each and the final metric will be weighted at 10%. The underlying strategy metrics have been revised from prior years to focus on shorter-term measures, as the long-term bonus emphasizes long-term performance. The 2014 plan also provides for an additional 5% payout if our goals for supermarket fuel EBITDA, supermarket fuel gallons sold, and targeted number of fuel centers in operation at the fiscal year end are achieved.table.
26
Long-Term IncentivesCompensation
The Compensation Committee believes in the importance of providing an incentive to the named executive officersNEOs to achieve the long-term goals established by the BoardBoard. As such, a majority of Directors by conditioning a significant portion of compensation is conditioned on the achievement of those goals.
In 2006, the Committee adopted the first in a series ofCompany’s long-term performance basedgoals and is delivered via four long-term compensation plans designed to reward participants for their contribution to the long-term performance of Kroger. These earlier plans provided for overlapping four year performance periods that allowed for the earning of a long-term cash bonus. In 2010, Kroger’s long-term incentive program was redesigned to combine the total value of ourvehicles: long-term cash bonus, performance units, stock options and equity programs into a cohesive, strategic reward for eligible executivesrestricted stock. Long-term compensation promotes long-term value creation and discourages the over-emphasis of attaining short-term goals at the Vice President level and above. Approximately fifty percentexpense of long-term growth.
The Compensation Committee considers several factors in determining the target value of long-term compensation awarded to the NEOs or, in the case of the planCEO, recommending to the independent directors the amount awarded. These factors include:
| ● | The compensation consultant’s benchmarking report regarding long-term compensation awarded by our peer group; |
| ● | The officer’s level in the organization and the internal relationship of long-term compensation awards within Kroger; |
| ● | Individual performance; and |
| ● | The recommendation of the CEO, for all NEOs other than the CEO. |
23
Long-term incentives are structured to be a combination of performance- and time-based compensation that reflects elements of financial and stock performance to provide both retention value is performance-based, delivered inand alignment with company performance. Long-term cash bonus and performance units,unit payouts are contingent on the achievement of certain strategic performance measures. The other fifty percent ofand financial measures and incentivize recipients to promote long-term value creation and enhance shareholder wealth by supporting the Company’s long-term strategic goals. Stock options and restricted stock are linked to stock performance creating alignment between executives and company shareholders. Options have no initial value and recipients only realize benefits if the value of our stock increases following the date of grant.
A majority of long-term compensation is time-based and delivered inequity-based (performance units, stock options, and restricted shares.stock) and is tied to the future value of our common shares, further aligning the interests of our NEOs with our shareholders. All four components of long-term compensation are intended to focus executive behaviors on our long-term strategy. Each component is described in more detail below.
Amounts of long-term compensation awards issued and outstanding for the NEOs are set forth in the tables that follow this discussion and analysis.
Performance Based Long-Term CompensationIncentive Plan Design
In contrast to the performance-based annual cash bonus plan, described above, which has approximately 13,000 participants, our performance-based Long-Term Incentive Plan has approximately 160 participants, including the NEOs. Each year we adopt a similar Long-Term Incentive Plan, which provides for overlapping three year performance periods. The Long-Term Incentive Plan consists of a performance-based long-term incentive plan adopted in 2010 (and earned in 2012) provides the model for our combined plan structure. Subsequent plans have been adopted each year thereafter. Each of these planscash bonus and performance units which has the following characteristics:
Performance is measured over a three year period.
Between 130 and 170 executives, including the named executive officers, participate in each plan.
Awards include both cash and performance units.
The long-term cash bonus | ||
| ● | ||
In addition, a fixed number of performance units is awarded to each |
Compensation under the plans is
The actual long-term cash bonus and number of performance units earned are each determined based on our performance against the same metrics established by the Compensation Committee (the independent directors, for the CEO) at the beginning of the performance period.
Performance at the end of the three-year period is measured against the baseline of each performance metric established at the beginning of the performance period.
The payout percentage, based on the extent to which the performance metrics are achieved, is applied to both the long-term cash bonus potential and the number of performance units awarded.
Actual payouts cannot exceed 100% of the long-term cash bonus potential or 100% of the number of performance units awarded.
The Compensation Committee anticipates adopting a new Long-Term Incentive Plan each year, measuring improvement over successive three-year periods. Each year when establishing the performance period.
The payoutmetric baselines and percentage based onpayouts per unit of improvement, the extent to whichCompensation Committee considers the performance metrics are achieved, is applied to both the bonus base and the numberdifficulty of achieving compounded improvement over time. During 2015, Kroger awarded 503,276 performance units awarded.
Actual payouts cannot exceed 100% ofto approximately 160 employees, including the cash bonus base or 100% of the number of performance units awarded.NEOs.
In no event can a cash bonus award exceed $5,000,000.
2724
Long-Term Incentive Plan Metrics and Connection to our Business Strategy
| Metric | Rationale for Use | |
| Customer 1stStrategy | ● | Kroger’s Customer 1stStrategy is the focus, in all of Kroger’s decision-making, on the customer. The Four Keys of Kroger’s Customer 1stStrategy are People, Products, Shopping Experience and Price. |
| ● | This proprietary metric measures the improvement in how Kroger is perceived by customers in each of the Four Keys. | |
| ● | Long-Term Incentive Plan payout is based on all of the elements of the Customer 1stStrategy, to maintain our top executives’ consistent focus on the entirety of the Customer 1stStrategy. This is in contrast to the annual cash bonus payout which is based on certain elements of the Customer 1stPlan, to highlight annual objectives that are intended to receive the most focused attention in that year. | |
| Improvement in Associate Engagement | ● | Kroger measures associate engagement in an annual survey of associates. |
| ● | This metric is included in the Long-Term Incentive Plan as an acknowledgement that our Company’s success is directly tied to our associates connecting with and serving our customers every day, whether in our stores, manufacturing plants, distribution centers or offices. | |
| Reduction in Operating Costs(1)as a Percentage of Sales, without Fuel | ● | An essential part of Kroger’s model is to increase productivity and efficiency, and to take costs out of the business in a sustainable way. |
| ● | We strive to be disciplined, so that as the Company grows, expenses are properly managed. | |
| ● | This metric is included in both the annual cash bonus plan and Long-Term Incentive Plans. Operating costs, without fuel, can be improved temporarily on an annual basis, but it is more difficult to maintain these reductions over time. | |
| ● | It is the role of the approximately 160 employees in the Long-Term Incentive Plan to continue to reduce operating costs as a percentage of sales,without fuel, over time and to ensure such reductions are sustainable over the long-term. Including this metric in the Long-term Incentive Plan, incentivizes these key employees to implement policies for sustainable improvement over a long period of time. | |
| ROIC(2) | ● | Part of our long-term growth strategy is to increase capital investments over time. We have a pipeline of high quality projects and new store openings, and we continue to increase the square footage in our fill-in markets. |
| ● | With increased capital spend,it is essential that we achieve the proper returns on our investments. | |
| ● | This measure is intended to hold executives accountable for the returns on the increased capital investments. | |
| (1) | Operating Costs is calculated as the sum of (i) operating, general and administrative expenses, depreciation and amortization, and rent expense, without fuel, and (ii) warehouse and transportation costs, shrink, and advertising expenses, for our supermarket operations, without fuel. Operating costs will exclude one-time expenses incurred in lieu of future anticipated obligations. Future expenses that are avoided by virtue of the incurrence of the one-time expense will be deemed to be total operating expenses in the year in which they otherwise would have been incurred. |
25
| (2) | Return on invested capital is calculated by dividing adjusted operating profit for the prior four quarters by the average invested capital. Adjusted operating profit is calculated by excluding certain items included in operating profit, and adding our LIFO charge, depreciation and amortization, and rent. Average invested capital will be calculated as the sum of (i) the average of our total assets, (ii) the average LIFO reserve, (iii) the average accumulated depreciation and amortization, and (iv) a rent factor equal to total rent for the last four quarters multiplied by a factor of eight; minus (i)the average taxes receivable, (ii) the average trade accounts payable, (iii) the average accrued salaries and wages, and (iv) the average other current liabilities, excluding accrued income taxes. |
The following table summarizes each of the long-term performance based plansLong-Term Incentive Plans adopted for the years shown:
| 2013 Plan | 2014 Plan | 2015 Plan | ||||||||
| Performance Period | 2013 to 2015 | 2014 to 2016 | 2015 to 2017 | |||||||
| Payout Date | March | March | March | |||||||
| Long-term Cash | Salary at end of | Salary at end of | Salary at end of | |||||||
| Bonus Potential | fiscal year | fiscal year | fiscal year | |||||||
| Performance Metrics | ||||||||||
| 2% payout per unit | 2% payout per unit | |||||||||
| improvement | improvement | improvement | ||||||||
| Improvement in Associate | 4% payout per unit | 4% payout per unit | 4% payout per unit | |||||||
| | improvement | improvement | improvement | |||||||
| Reduction in Operating Cost as a | 0.50% payout per | 0.50% payout per | 0.50% payout per | |||||||
| | ||||||||||
| | in operating costs | in operating costs | in operating costs | |||||||
| Baseline: 26.69% | Baseline: 26.68% | Baseline: 26.41% | ||||||||
| ROIC | 1% payout per | 1% payout per | 1% payout per | |||||||
| 0.01% improvement | 0.01% improvement | 0.01% improvement | ||||||||
| in ROIC | in ROIC | |||||||||
| Baseline: 13.27% | Baseline: | Baseline: |
| * | Or date of plan entry, if later. |
At the time of adopting new long-term plans, theThe Compensation Committee has made adjustments to the percentage payouts for the components of the long-term plansLong-Term Incentive Plans over time to account for the increasing difficulty of achieving compounded improvement.
During 2015, Kroger awarded 503,276 performance units to approximately 160 employees, including the NEOs.
26
Results of 2013 Long-Term Incentive Plan
The Committee anticipates adopting a new plan each year, measuring improvement over successive three-year periods.
The long-term performance based plan adopted in 2011,2013 Long-Term Incentive Plan, which measured improvements through fiscalover the three year period from 2013 to 2015, paid out in March 20142016 and was calculated as follows:
| Percentage | ||||||||||||||||||
| Component | Baseline | Result | Improvement | Multiplier | Earned | |||||||||||||
| Strategic Plan | * | * | 6 units of improvement | 2% | 12.00% | |||||||||||||
| Associate Engagement | * | * | 8 units of improvement | 2% | 6.00% | |||||||||||||
| Operating Costs, as a Percentage of | ||||||||||||||||||
| Sales, Excluding Fuel | 27.60% | 26.76% | 84 basis point improvement | 0.50% | 42.00% | |||||||||||||
| Total Earned | 70.00% | |||||||||||||||||
| Payout per | Percentage | ||||||||||||
| Improvement | Improvement | Earned | |||||||||||
| Metric | Baseline | Result(1) | (A) | (B) | (A) x (B) | ||||||||
| Customer 1st | 12 units of | ||||||||||||
| Strategy(2) | * | * | improvement | 2.00% | 24.00 | % | |||||||
| Improvement | |||||||||||||
| in Associate | 2 units of | ||||||||||||
| Engagement(2) | * | * | improvement | 4.00% | 8.00 | % | |||||||
| Reduction in Operating | |||||||||||||
| Cost as a Percentage | 56 basis point | ||||||||||||
| of Sales, without Fuel | 26.69% | 26.13% | improvement | 0.50% | 28.00 | % | |||||||
| Return on Invested | 66 basis point | ||||||||||||
| Capital | 13.27% | 13.93% | improvement | 1.00% | 66.00 | % | |||||||
| Total | 126.00 | % | |||||||||||
| Total Earned: Payout is | |||||||||||||
| capped at 100% | 100.00 | % | |||||||||||
| Results exclude Harris Teeter and Roundy’s because the mergers occurred after the performance goals were established. | ||
| (2) | The | |
Accordingly, each named executive officerNEO received a long-term cash bonus in an amount equal to 70.00%100% of that executive’s long-term cash bonus base,potential, and was issued the number of Kroger common shares equal to 70.00%100% of the number of performance units awarded to that executive, along with a cash amount equal to the dividends paid on that number of common shares during the three year performance period. Payout for the cash components of the 2011 plan2013 Long-Term Incentive Plan are reported in the “Non-Equity Incentive Plan Compensation” and “All Other Compensation” columns of the Summary Compensation Table and footnotes 4 and 6 to that table, and the common shares issued under the plan are reported in the Options Exercised2015 Option Exercises and Stock Vested Table and footnote 2 to that table.
28
Equity AwardsStock Options and Restricted Stock
AwardsStock options and restricted stock continue to play an important role in rewarding NEOs for the achievement of long-term business objectives and providing incentives for the creation of shareholder value.Awards based on Kroger’s common shares are granted periodicallyannually to the named executive officersNEOs and a large number of other employees. Equity participation alignsKroger historically has distributed time-based equity awards widely, aligning the interests of employees with your interest as shareholders, and Kroger historically has distributed equity awards widely. shareholders.
In 2013,2015, Kroger granted 4,211,1023,425,720 stock options to approximately8,151 1,222 employees, including the named executive officers.NEOs. The options permit the holder to purchase Kroger common shares at an option price equal to the closing price of Kroger common shares on the date of the grant.
During 2015, Kroger awarded 3,228,270 shares of restricted stock to approximately 8,280 employees, including the NEOs.
Options are granted only on one of the four dates of Compensation CommitteeBoard meetings conducted after Kroger’s public release of its quarterly earnings results. The Compensation Committee determines the vesting schedule for stock options and restricted stock.
Kroger’s long-term incentive plans also provide for other equity-based awards, includingDuring 2015, the Compensation Committee granted to the NEOs: (a) stock options with a five-year vesting schedule; and (b) restricted stock andwith a three- or five-year vesting schedule.
27
As discussed below under Stock Ownership Guidelines, covered individuals, including the NEOs, must hold 100% of common shares issued pursuant to performance units. During 2013, Kroger awarded 3,116,214units earned, the shares received upon the exercise of stock options or upon the vesting of restricted stock, except those necessary to approximately 20,214 employees, includingpay the named executive officers; and 413,588 performance units to approximately 167 employees. Performance units provideexercise price of the options and/or applicable taxes, until applicable stock ownership guidelines are met, unless the disposition is approved in advance by the CEO, or by the Board or Compensation Committee for the issuance of Kroger common shares to participants, after the completion of the three year performance period, based on the extent to which the performance goals established at the beginning of the performance period have been achieved.
The Committee considers several factors in determining the amount of options, restricted shares, and performance units awarded to the named executive officers or, in the case of the CEO, recommending to the independent directors the amount awarded. These factors include:
The compensation consultant’s benchmarking report regarding equity-based and other long-term compensation awarded by our competitors;
The officer’s level in the organization and the internal relationship of equity-based awards within Kroger;
Individual performance; and
The recommendation of the CEO, for all named executive officers other than the CEO.
The Committee has long recognized that the amount of compensation provided to the named executive officers through equity-based pay is often below the amount paid by our competitors. Lower equity-based awards for the named executive officers and other senior management permit a broader base of Kroger employees to participate in equity awards.
Amounts of equity awards issued and outstanding for the named executive officers are set forth in the tables that follow this discussion and analysis.
Retirement and Other Benefits
Kroger maintains a defined benefit and several defined contribution retirement plans for its employees. The named executive officersNEOs participate in one or more of these plans, as well as one or more excess plans designed to make up the shortfall in retirement benefits created by limitations under the Internal Revenue Code on benefits to highly compensated individuals under qualified plans. Additional details regarding certain retirement benefits available to the named executive officersNEOs can be found below in the 20132015 Pension Benefits tableTable and the accompanying narrative description that follows this discussion and analysis.
Kroger also maintains an executive deferred compensation plan in which some of the named executive officersNEOs participate. This plan is a nonqualified plan under which participants can elect to defer up to 100% of their cash compensation each year. CompensationAdditional details regarding our nonqualified deferred bears interest, until paid out, atcompensation plans available to the rate representing Kroger’s cost of ten-year debtNEOs can be found below in the yearNonqualified Deferred Compensation Table and the rate is set, as determined by Kroger’s CEO, and reviewed with the Committee, prior to the beginning of each deferral year. In 2013, that rate was 3.8%. Deferred amounts are paid out only in cash, in accordance with a deferral option selected by the participant at the time the deferral election is made.accompanying narrative.
We adoptedKroger also maintains The Kroger Co. Employee Protection Plan or KEPP, during fiscal year 1988. That plan was amended and restated in 2007. All(“KEPP”), which covers all of our management employees and administrative support personnel who have provided services to Kroger for at least one year and whose employment is not covered by a collective bargaining agreement, with at least one year of service, are covered.agreement. KEPP provides for severance benefits and extended Kroger-paid health care, as well as the continuation of other benefits as described in the plan, when an employee is actually or constructively terminated without
29
cause within two years following a change in control of Kroger (as defined in the plan)KEPP). Participants are entitled to severance pay of up to 24 months’ salary and bonus. The actual amount is dependent upon pay level and years of service. KEPP can be amended or terminated by the Board at any time prior to a change in control.
StockPerformance-based long-term cash bonus, performance unit, stock option, and restricted stock and performance unit agreements with participants in Kroger’s long-term incentive plansaward recipients provide that those awards “vest,” with options becoming immediately exercisable, restrictions on restricted stock lapsing, and50% of the long-term cash bonus potential being paid, common shares equal to 50% of the performance units being awarded, options becoming immediately exercisable, and restrictions on restricted stock lapsing upon a change in control as described in the grant agreements.
None of the named executive officersNEOs is party to an employment agreement.
Perquisites
TheNEOs receive limited perquisites because the Compensation Committee does not believe that it is necessary for the attraction or retention of management talent to provide the named executive officersNEOs a substantial amount of compensation in the form of perquisites. In 2013,2015, the only perquisites available to our named executive officersNEOs were:
| ● | premiums paid on life insurance policies; |
| ● | premiums paid on accidental death and dismemberment insurance; and |
| ● | premiums paid on long-term disability insurance policies. |
premiums paid on life insurance policies,
premiums paid on accidental death and dismemberment insurance; and
premiums paid on long-term disability insurance policies.
The life insurance benefitBecause he was offered beginning several years ago to replace a split-dollar life insurance benefit thatan officer of Harris Teeter during 2015, Mr. Morganthall also was substantially more costly to Kroger. Currently, 159active executives, including the named executive officers, and87 retired executives, receive this benefit.
In addition, the named executive officers are entitled toeligible for the following benefit that does not constitute a perquisite as defined by SEC rules: personal use of Kroger aircraft, which officers may lease from Kroger and pay the average variable cost of operating the aircraft, making officers more available and allowing for a more efficient use of their time.Harris Teeter perquisites:
| ● | premiums paid on executive bonus insurance policies; and |
| ● | tax reimbursements for the taxes due on insurance premiums paid by Harris Teeter. |
The total amount of perquisites furnished to the named executive officersNEOs is shown in the Summary Compensation Table and described in more detail in footnote 6 to that table.
28
Process for Establishing Executive Compensation
The Compensation Committee of the Board has the primary responsibility for establishing the compensation of our executive officers, including the NEOs, with the exception of the Chief Executive Officer. The Compensation Committee’s role regarding the CEO’s compensation is to make recommendations to the independent members of the Board; those members of the Board establish the CEO’s compensation.
The Compensation Committee directly engages a compensation consultant from Mercer Human Resource Consulting to advise the Compensation Committee in the design of compensation for executive officers.
The Mercer consultant conducts an annual competitive assessment of executive positions at Kroger for the Compensation Committee. The assessment is one of several bases, as described above, on which the Compensation Committee determines compensation. The consultant assesses:
| ● | Base salary; |
| ● | Target performance-based annual cash bonus; |
| ● | Target annual cash compensation (the sum of salary and annual cash bonus potential); |
| ● | Annualized long-term compensation, such as performance-based long-term cash bonus potential and performance units, stock options and restricted stock; and |
| ● | Total direct compensation (the sum of target annual cash compensation and annualized long-term compensation). |
The consultant compares these elements against those of other companies in a group of publicly-traded food and drug retailers. For 2015, our peer group consisted of:
| Costco Wholesale | SUPERVALU |
| CVS Health, formerly CVS Caremark | Target |
| Rite Aid | Wal-Mart |
| Safeway | Walgreens Boots Alliance, formerly Walgreen |
This peer group is the same group as was used in 2014. Median 2015 revenue for the peer group was $92.5 billion, compared to our revenue of $109.8 billion. The make-up of the compensation peer group is reviewed annually and modified as circumstances warrant. Industry consolidation and other competitive forces will result in changes to the peer group over time.
The consultant also provides the Compensation Committee data from “general industry” companies, a representation of major publicly-traded companies of similar size and scope from outside the retail industry. This data serves as reference points, particularly for senior staff positions where competition for talent extends beyond the retail sector.
Considering the size of Kroger in relation to other peer group companies, the Compensation Committee believes that salaries paid to our NEOs should be at or above the median paid by peer group companies for comparable positions. The Compensation Committee also aims to provide an annual cash bonus potential to our NEOs that, if the increasingly more challenging annual business plan objectives are achieved at superior levels, would cause total cash compensation to be meaningfully above the median. Actual payouts may be as low as zero if performance does not meet the baselines established by the Compensation Committee.
The independent members of the Board have the exclusive authority to determine the amount of the CEO’s compensation. In setting total compensation, the independent directors consider the median compensation of the peer group’s CEOs. With respect to the annual bonus, the independent directors make two determinations: (1) they determine the annual cash bonus potential that will be multiplied by the annual cash bonus payout percentage earned that is generally applicable to all corporate management, including the NEOs and (2) the independent directors determine the annual cash bonus amount paid to the CEO by retaining discretion to reduce the annual cash bonus percentage payout the CEO would otherwise receive under the formulaic plan.
29
The Compensation Committee performs the same function and exercises the same authority as to the other NEOs. In its annual review of compensation for the NEOs the Compensation Committee:
| ● | Conducts an annual review of all components of compensation, quantifying total compensation for the NEOs on tally sheets. The review includes a summary for each NEO of salary; performance-based annual cash bonus; long-term performance-based cash and performance unit compensation; stock options; restricted stock; accumulated realized and unrealized stock option gains and restricted stock and performance unit values; the value of any perquisites; retirement benefits; company paid health and welfare benefits; banked vacation; severance benefits available under KEPP; and earnings and payouts available under Kroger’s nonqualified deferred compensation program. |
| ● | Considers internal pay equity at Kroger to ensure that the CEO is not compensated disproportionately. The Compensation Committee has determined that the compensation of the CEO and that of the other NEOs bears a reasonable relationship to the compensation levels of other executive positions at Kroger taking into consideration performance and differences in responsibilities. |
| ● | Reviews a report from the Compensation Committee’s compensation consultants comparing NEO and other senior executive compensation with that of other companies, including both our peer group of competitors and a larger general industry group, to ensure that the Compensation Committee’s objectives of competitiveness are met. |
| ● | Takes into account a recommendation from the CEO (except in the case of his own compensation) for salary, annual cash bonus potential and long-term compensation awards for each of the senior officers including the other NEOs. The CEO’s recommendation takes into consideration the objectives established by and the reports received by the Compensation Committee as well as his assessment of individual job performance and contribution to our management team. |
In considering each of the factors above, the Compensation Committee does not make use of a formula, but rather quantitatively reviews each factor in setting compensation.
Advisory Vote to Approve Executive Compensation
At the 2015 annual meeting, we held our fifth annual advisory vote on executive compensation. Over 95% of the votes cast were in favor of the advisory proposal in 2015. The Compensation Committee believes it conveys our shareholders’ support of the Compensation Committee’s decisions and the existing executive compensation programs. As a result, the Compensation Committee made no material changes in the structure of our compensation programs or our pay for performance philosophy.
At the 2016 annual meeting, in keeping with our shareholders’ request for an annual advisory vote, we will again hold an advisory vote to approve executive compensation (see page 49). The Compensation Committee will continue to consider the results from this year’s and future advisory votes on executive compensation in their evaluation and administration of our compensation program.
Stock Ownership Guidelines
To more closely align the interests of our officers and directors with your interests as shareholders, the Board has adopted stock ownership guidelines. These guidelines require non-employee directors, executive officers, and other key executives to acquire and hold a minimum dollar value of Kroger common shares as set forth below:
| Position | Multiple | |
| Chief Executive Officer | 5 times base salary | |
| Vice Chairman, President and Chief Operating Officer | 4 times base salary | |
| Executive Vice Presidents and Senior Vice Presidents | 3 times base salary | |
| Other Key Executives | 2 times base salary | |
| Non-employee Directors | 3 times annual base cash retainer |
30
Covered individuals are expected to achieve the target level within five years of appointment to their position. If the requirements are not met, individuals, including the NEOs, must hold 100% of common shares issued pursuant to performance units earned,shares received upon the exercise of stock options and upon the vesting of restricted stock, except those necessary to pay the exercise price of the options and/or applicable taxes, and must retain all Kroger shares unless the disposition is approved in advance by the CEO, or by the Board or Compensation Committee for the CEO.
Executive Compensation Recoupment Policy (Clawback)
If a material error of facts results in the payment to an executive officer at the level of Group Vice President or higher of an annual cash bonus or a long-term cash bonus in an amount higher than otherwise would have been paid, as determined by the Compensation Committee, then the officer, upon demand from the Compensation Committee, will reimburse Kroger for the amounts that would not have been paid if the error had not occurred. This recoupment policy applies to those amounts paid by Kroger within 36 months prior to the detection and public disclosure of the error. In enforcing the policy, the Compensation Committee will take into consideration all factors that it deems appropriate, including:
| ● | The materiality of the amount of payment involved; |
| ● | The extent to which other benefits were reduced in other years as a result of the achievement of performance levels based on the error; |
| ● | Individual officer culpability, if any; and |
| ● | Other factors that should offset the amount of overpayment. |
Compensation Policies as They Relate to Risk Management
As part of the amountCompensation Committee’s review of payment involved;
Theour compensation practices, the Compensation Committee considers and analyzes the extent to which risks arise from such practices and their impact on Kroger’s business. As discussed in this discussion and analysis, our policies and practices for compensating employees are designed to, among other benefits were reduced in other yearsthings, attract and retain high quality and engaged employees. In this process, the Compensation Committee also focuses on minimizing risk through the implementation of certain practices and policies, such as the executive compensation recoupment policy, which is described above under “Executive Compensation Recoupment Policy (Clawback)”. Accordingly, we do not believe that our compensation practices and policies create risks that are reasonably likely to have a result of the achievement of performance levels basedmaterial adverse effect on the error;Kroger.
Individual officer culpability, if any; and
Other factors that should offset the amount of overpayment.
30
Prohibition on Hedging Policyand Pledging
After considering best practices related to ownership of company shares, the Board has adopted a policy regarding hedging, pledging and short sales of Kroger securities. Kroger directors and officers are prohibited from engaging, directly or indirectly, in hedging transactions in, or short sales of, Kroger securities. In addition, they are precludedthe policy was further revised as of April 1, 2016, to preclude Kroger officers and directors from pledging Kroger securities as collateral for a loan, except to the extent that shares so pledged are in excess of the number of shares the individual is required to maintain in accordance with Kroger’s share ownership guidelines more particularly described earlier in this compensation discussion and analysis.securities.
Section 162(M)162(m) of the Internal Revenue Code
Tax laws place a deductibility limit of $1,000,000 on some types of compensation for the CEO and the next four most highly compensated officers (other than the chief financial officer) reported in this proxy because they are among the four highest compensated officers (“covered employees”). In Kroger’s case, this group of individuals is not identical to the group of named executive officers.NEOs. Compensation that is deemed to be “performance-based” is excluded for purposes of the calculation and is tax deductible. Awards under Kroger’s long-term incentive plans,Long-Term Incentive Plans, when payable upon achievement of stated performance criteria, should be considered performance-based and the compensation paid under those plans should be tax deductible. Generally, compensation expense related to stock options awarded to the CEO and the next four most highly compensated officers should be deductible. On the other hand, Kroger’s awards of restricted stock that vest solely upon the passage of time are not performance-based. As a result,
31
compensation expense for those awards to the covered employees is not deductible, to the extent that the related compensation expense, plus any other expense for compensation that is not performance-based, exceeds $1,000,000.
Kroger’s bonus plans rely on performance criteria, andwhich have been approved by shareholders. As a result, bonuses paid under the plans to the covered employees willshould be deductible by Kroger.
Kroger’s policy is, primarily, to design and administer compensation plans that support the achievement of long-term strategic objectives and enhance shareholder value. Where it is material and supports Kroger’s compensation philosophy, the Compensation Committee also will attempt to maximize the amount of compensation expense that is deductible by Kroger.
| Compensation Committee Report |
The Compensation Committee has reviewed and discussed with management of the Company the Compensation Discussion and Analysis contained in this proxy statement. Based on its review and discussions with management, the Compensation Committee has recommended to the Company’s Board of Directors that the Compensation Discussion and Analysis be included in the Company’s proxy statement and incorporated by reference into its annual reportAnnual Report on Form 10-K.
Compensation Committee:
Clyde R. Moore, Chair
Jorge P. Montoya
Susan M. Phillips
James A. Runde
3132
Executive Compensation Tables
Summary Compensation Table
The following table showsand footnotes provide information regarding the compensation of the former Chief Executive Officer, Chief Executive Officer, Chief Financial Officer and each of the Company’s three most highly compensated executive officers other than the former CEO, CEO and CFO (the “named executive officers”) duringNEOs for the fiscal years presented:presented.
| Summary Compensation Table | |||||||||||||||||||||||||||||||||||||||
| Change in | |||||||||||||||||||||||||||||||||||||||
| Pension | |||||||||||||||||||||||||||||||||||||||
| Value and | |||||||||||||||||||||||||||||||||||||||
| Nonqualified | |||||||||||||||||||||||||||||||||||||||
| Non-Equity | Deferred | ||||||||||||||||||||||||||||||||||||||
| Stock | Option | Incentive Plan | Compensation | All Other | |||||||||||||||||||||||||||||||||||
| Name and Principal | Salary | Bonus | Awards | Awards | Compensation | Earnings | Compensation | Total | |||||||||||||||||||||||||||||||
| Position | Year | ($) | ($) | ($) | ($) | ($) | ($) | ($) | ($) | ||||||||||||||||||||||||||||||
| (1) | (2) | (3) | (4) | (5) | (6) | ||||||||||||||||||||||||||||||||||
| David B. Dillon | 2013 | $ | 1,346,161 | — | $ | 5,709,429 | $ | 2,781,910 | $ | 2,456,235 | $ | 15,376 | $ | 459,584 | $ | 12,768,695 | |||||||||||||||||||||||
| Chairman and Former | 2012 | $ | 1,328,320 | — | $ | 3,332,852 | $ | 1,342,088 | $ | 1,600,065 | $ | 3,380,527 | $ | 301,985 | $ | 11,285,837 | |||||||||||||||||||||||
| Chief Executive Officer | 2011 | $ | 1,273,871 | — | $ | 3,130,540 | $ | 1,716,693 | $ | 2,699,153 | $ | 3,088,686 | $ | 232,820 | $ | 12,141,763 | |||||||||||||||||||||||
| W. Rodney McMullen | 2013 | $ | 962,731 | — | $ | 5,062,435 | $ | 907,862 | $ | 1,722,946 | $ | 63,518 | $ | 166,329 | $ | 8,885,821 | |||||||||||||||||||||||
| Chief Executive Officer | 2012 | $ | 937,732 | — | $ | 1,087,655 | $ | 437,983 | $ | 1,079,085 | $ | 1,415,003 | $ | 124,998 | $ | 5,082,456 | |||||||||||||||||||||||
| 2011 | $ | 899,113 | — | $ | 1,009,368 | $ | 553,506 | $ | 1,821,903 | $ | 1,768,792 | $ | 104,573 | $ | 6,157,255 | ||||||||||||||||||||||||
| J. Michael Schlotman | 2013 | $ | 688,599 | — | $ | 1,564,689 | $ | 509,088 | $ | 1,004,220 | $ | — | $ | 85,176 | $ | 3,851,772 | |||||||||||||||||||||||
| Senior Vice President | 2012 | $ | 669,787 | — | $ | 609,908 | $ | 245,602 | $ | 602,146 | $ | 822,669 | $ | 60,137 | $ | 3,010,249 | |||||||||||||||||||||||
| and Chief Financial | 2011 | $ | 631,371 | — | $ | 503,801 | $ | 276,269 | $ | 1,002,310 | $ | 990,524 | $ | 45,269 | $ | 3,449,544 | |||||||||||||||||||||||
| Officer | |||||||||||||||||||||||||||||||||||||||
| Kathleen S. Barclay | 2013 | $ | 686,702 | — | $ | 1,436,930 | $ | 307,838 | $ | 1,026,620 | $ | — | $ | 144,953 | $ | 3,603,043 | |||||||||||||||||||||||
| Senior Vice President | 2012 | $ | 675,972 | — | $ | 491,998 | $ | 148,512 | $ | 628,271 | $ | — | $ | 96,054 | $ | 2,040,807 | |||||||||||||||||||||||
| Paul W. Heldman | 2013 | $ | 772,298 | — | $ | 944,621 | $ | 460,267 | $ | 1,084,020 | $ | 11,645 | $ | 156,184 | $ | 3,429,035 | |||||||||||||||||||||||
| Executive Vice | 2012 | $ | 761,501 | — | $ | 551,418 | $ | 222,048 | $ | 648,071 | $ | 1,266,466 | $ | 115,715 | $ | 3,565,219 | |||||||||||||||||||||||
| President, Secretary | 2011 | $ | 730,682 | — | $ | 479,075 | $ | 262,710 | $ | 1,110,126 | $ | 1,374,309 | $ | 96,977 | $ | 4,053,879 | |||||||||||||||||||||||
| and General Counsel | |||||||||||||||||||||||||||||||||||||||
| Michael L. Ellis | 2013 | $ | 539,576 | — | $ | 1,484,681 | $ | 236,283 | $ | 755,571 | $ | 1,944 | $ | 64,332 | $ | 3,082,387 | |||||||||||||||||||||||
| President and | |||||||||||||||||||||||||||||||||||||||
| Chief Operating Officer | |||||||||||||||||||||||||||||||||||||||
| Name and Principal Position(1) | Fiscal Year | Salary | Stock Awards ($)(2) | Option | Non-Equity Incentive Plan Compensation ($)(4) | Change in | All Other Compensation ($)(6) | Total ($) | ||||||||||||||
| W. Rodney McMullen | 2015 | 1,216,665 | 4,332,252 | 2,300,092 | 2,999,693 | 618,033 | 279,656 | 11,746,391 | ||||||||||||||
| Chairman and Chief | 2014 | 1,118,726 | 3,740,251 | 1,951,394 | 2,441,546 | 3,498,396 | 232,602 | 12,982,915 | ||||||||||||||
| Executive Officer | 2013 | 962,731 | 5,062,435 | 907,862 | 1,722,946 | 63,518 | 166,329 | 8,885,821 | ||||||||||||||
| J. Michael Schlotman | 2015 | 793,825 | 2,489,148 | 1,040,847 | 1,394,752 | 44,163 | 148,104 | 5,910,839 | ||||||||||||||
| Executive Vice President | 2014 | 745,313 | 1,490,700 | 520,372 | 1,103,750 | 1,922,821 | 113,922 | 5,896,878 | ||||||||||||||
| and Chief Financial | 2013 | 688,599 | 1,564,689 | 509,088 | 1,004,220 | — | 85,176 | 3,851,772 | ||||||||||||||
| Officer | ||||||||||||||||||||||
| Michael J. Donnelly | 2015 | 700,684 | 1,919,013 | 585,529 | 1,274,152 | 321,545 | 175,112 | 4,976,035 | ||||||||||||||
| Executive Vice President | 2014 | 651,315 | 748,051 | 390,279 | 1,024,261 | 341,775 | 100,305 | 3,255,986 | ||||||||||||||
| of Merchandising | 2013 | 565,136 | 1,099,201 | 236,283 | 803,052 | 3,744 | 81,557 | 2,778,973 | ||||||||||||||
| Christopher T. Hjelm | 2015 | 653,368 | 1,992,003 | 780,633 | 1,302,852 | 168 | 98,992 | 4,828,016 | ||||||||||||||
| Executive Vice President | ||||||||||||||||||||||
| and Chief Information | ||||||||||||||||||||||
| Officer | ||||||||||||||||||||||
| Frederick J. Morganthall II | 2015 | 619,944 | 1,595,918 | 390,414 | 1,453,450 | — | 297,335 | 4,357,061 | ||||||||||||||
| Executive Vice President | ||||||||||||||||||||||
| of Retail Operations | ||||||||||||||||||||||
| (1) | Messrs. Hjelm and Morganthall became | |
| (2) | Amounts reflect the | |
| Name | Restricted Stock | Performance Units | ||||
| Mr. McMullen | $3,300,021 | $1,032,231 | ||||
| Mr. Schlotman | $1,979,946 | $509,202 | ||||
| Mr. Donnelly | $1,632,562 | $286,451 | ||||
| Mr. Hjelm | $1,610,062 | $381,941 | ||||
| Mr. Morganthall | $1,404,958 | $190,960 | ||||
The grant date fair value of the performance units reflected in the stock awards column and in the table above is computed based on the probable outcome of the performance conditions as of the grant date. This amount is consistent with the estimate of aggregate compensation cost to be recognized by the Company over the three-year performance period of the award determined as of the grant date under FASB ASC Topic 718, excluding the effect of estimated forfeitures. The assumptions used in calculating the valuations are set forth in Note 12 to the consolidated financial statements in Kroger’s 10-K for fiscal year 2015.
33
Assuming that the highest level of performance conditions is achieved, the aggregate fair value of the 2015 performance unit awards at the grant date is as follows:
| Value of Performance Units | |||||
| Name | Assuming Maximum Performance | ||||
| Mr. McMullen | $ | 2,064,462 | |||
Mr. Schlotman | $ | 1,018,403 | |||
| Mr. Donnelly | $ | 572,901 | |||
| Mr. Hjelm | $ | 763,881 | |||
| Mr. Morganthall | $ | 381,921 | |||
| (3) | These amounts represent the aggregate grant date fair value of option awards computed in accordance with FASB ASC Topic 718. The assumptions used in calculating the valuations are set forth in Note 12 to the consolidated financial statements in Kroger’s 10-K for fiscal year 2015. |
| (4) | Non-equity incentive plan compensation earned for 2015 consists of amounts earned under the 2015 performance-based annual cash bonus program and the 2013 Long-Term Incentive Plan. The amount reported for Mr. Morganthall also includes the 2015 amount earned under the Harris Teeter Merger Cash Bonus Plan (described below). |
| Long-Term Cash | Harris Teeter | |||||||||||||
| Name | Annual Cash Bonus | Bonus | Merger Bonus | |||||||||||
| Mr. McMullen | $ | 2,060,093 | $ | 939,600 | N/A | |||||||||
| Mr. Schlotman | $ | 723,652 | $ | 671,100 | N/A | |||||||||
| Mr. Donnelly | $ | 723,652 | $ | 550,500 | N/A | |||||||||
| Mr. Hjelm | $ | 723,652 | $ | 579,200 | N/A | |||||||||
| Mr. Morganthall | $ | 645,010 | $ | 369,083 | $439,357 | |||||||||
In accordance with the terms of the 2015 performance-based annual cash bonus program, Kroger paid 126.7% of bonus potentials for the participants, including the NEOs. These amounts were earned with respect to performance in 2015 and paid in March 2016. Mr. Morganthall’s annual cash bonus payout was calculated by using the Harris Teeter formula for the 17 weeks he was a Harris Teeter officer and the Kroger formula for the remainder of the year when he was a Kroger officer.
The long-term cash bonus awarded under the 2013 Long-Term Incentive Plan is a performance-based bonus plan designed to reward participants for improving the long-term performance of the Company. The plan covered performance during fiscal years 2013, 2014 and 2015 and amounts earned under the plan were paid in March 2016. In accordance with the terms of the plan, participants earned and Kroger paid 100% of long-term cash bonus potentials. The long-term cash bonus potential equaled the participant’s salary in effect on the last day of fiscal 2012, and for Mr. Morganthall, the day he became eligible for the plan.
Amounts for Mr. Morganthall also include $439,357 for 2015 performance under The Harris Teeter Merger Cash Bonus Plan. This plan is a performance-based bonus plan designed to reward participants for achieving synergies over the three year period following the merger between Harris Teeter and Kroger, fiscal years 2014, 2015 and 2016. Payouts are made following the end of each fiscal year of amounts earned based on that year’s performance, subject to a maximum payout over the three-year period of 200% of the participant’s bonus potential. The bonus potential is equal to the participant’s salary in effect on the date of the merger. In March 2016, Mr. Morganthall received $439,357 for 2015 performance.
34
| (5) | For 2015, the amounts reported consist of the aggregate change in the actuarial present value of the NEO’s accumulated benefit under a defined benefit pension plan (including supplemental plans), which applies to all eligible NEOs, and preferential earnings on nonqualified deferred compensation, which applies to Messrs. McMullen, Donnelly and Hjelm: |
| Change in | Preferential Earnings on Nonqualified | ||||||||||
| Name | Pension Value | Deferred Compensation | |||||||||
| Mr. McMullen | $ | 537,941 | $ | 80,092 | |||||||
| Mr. Schlotman | $ | 44,163 | N/A | ||||||||
| Mr. Donnelly | $ | 316,969 | $ | 4,576 | |||||||
| Mr. Hjelm | $ | (1,142 | ) | $ | 168 | ||||||
| Mr. Morganthall | $ | (429,556 | ) | N/A | |||||||
The change in value of the accumulated pension benefit for each of Messrs. Hjelm and Morganthall are not included in the table because the value decreased.
Amounts reported for 2015 and 2014 include the change in the actuarial present value of accumulated pension benefits and preferential earnings on nonqualified deferred compensation. Amounts reported for 2013 include only preferential earnings on nonqualified deferred compensation because the changes in pension value were negative, which are not required to be reported in the table in accordance with SEC rules. Pension values may fluctuate significantly from year to year depending on a number of factors, including age, years of service, average annual earnings and the assumptions used to determine the present value, such as the discount rate. The change in the actuarial present value of accumulated pension benefits for 2014 was significantly greater than 2013 primarily due to a lower discount rate and revised mortality assumptions. The change in the actuarial present value of accumulated pension benefits for 2015 is primarily due to a lower discount rate. Please see the Pension Benefits section for further information regarding the assumptions used in calculating pension benefits.
Messrs. McMullen, Donnelly and Hjelm participate in Kroger’s nonqualified deferred compensation plan. Under the plan, deferred compensation earns interest at a rate representing Kroger’s cost of ten-year debt, as determined by the CEO and approved by the Compensation Committee prior to the beginning of each deferral year. For each participant, a separate deferral account is created each year and the interest rate established for that year is applied to that deferral account until the deferred compensation is paid out. If the interest rate established by Kroger for a particular year exceeds 120% of the applicable federal long-term interest rate that corresponds most closely to the plan rate, the amount by which the plan rate exceeds 120% of the corresponding federal rate is deemed to be above-market or preferential. In thirteen of the twenty-two years in which at least one NEO deferred compensation, the rate set under the plan for that year exceeds 120% of the corresponding federal rate. For each of the deferral accounts in which the plan rate is deemed to be above-market, Kroger calculates the amount by which the actual annual earnings on the account exceed what the annual earnings would have been if the account earned interest at 120% of the corresponding federal rate, and discloses those amounts as preferential earnings. Amounts deferred in 2015 earn interest at a rate lower than 120% of the corresponding federal rate; accordingly there are no preferential earnings on these amounts. In 2015, Mr. Morganthall participated in the Harris Teeter Supermarkets, Inc.Flexible Deferral Plan (the “HT Flexible Deferral Plan”), which does not provide above-market or preferential earnings on deferred compensation.
35
| (6) | Amounts reported in the “All Other Compensation” column for 2015 include: the dollar value of premiums paid by the Company for life insurance, Company contributions to defined contribution retirement plans, dividend equivalents paid on earned performance units, dividends paid on unvested restricted stock and other benefits. The following table identifies the perquisites and other compensation for 2015 that are required to be quantified by SEC rules. |
| Name | Life Insurance Premiums | Retirement Plan Contributions(a) | Payment of Dividend Equivalents on Earned Performance Units | Dividends Paid on Unvested Restricted Stock | Other(b) | ||||||||||||||||||
| Mr. McMullen | $ | 76,340 | — | $ | 50,791 | $ | 152,525 | — | |||||||||||||||
| Mr. Schlotman | $ | 60,878 | — | $ | 28,481 | $ | 58,745 | — | |||||||||||||||
| Mr. Donnelly | $ | 54,525 | $ | 69,169 | $ | 13,219 | $ | 38,199 | — | ||||||||||||||
| Mr. Hjelm | $ | 36,781 | $ | 12,867 | $ | 13,219 | $ | 36,125 | — | ||||||||||||||
| Mr. Morganthall | $ | 20,940 | $ | 34,466 | $ | 6,689 | $ | 61,583 | $ | 173,657 | |||||||||||||
| (a) | Retirement plan contributions.The Company makes automatic and matching contributions to NEOs’ accounts under the applicable defined contribution plan on the same terms and using the same formulas as |
●Mr. Donnelly – $13,603 to the Dillon Companies, Inc. Employees’ Profit Sharing Plan and $55,566 to the Dillon Companies, Inc. Excess Benefit Profit Sharing Plan; | |
●Mr. Hjelm – $12,867 to The Kroger Co. 401(k) Retirement Savings Account Plan, which includes a $2,000 automatic Company contribution; and | |
●Mr. Morganthall – $20,991 to the Harris Teeter Supermarkets, Inc. Retirement and Savings Plan, which includes a $13,000 automatic Company contribution, and $13,475 to the Harris Teeter Supermarkets, Inc. Flexible Deferral Plan. | |
| (b) | Other.For each of Messrs. McMullen, Schlotman, Donnelly and Hjelm the total amount of other benefits provided was less than $10,000. |
| For Mr. Morganthall, this amount includes the dollar value of insurance premiums paid by the | |
36
2015 Grants of Plan-Based Awards
The following table provides information about equity and non-equity incentive awards granted to the NEOs in 2015.
| Name | Grant Date | Estimated Future Payouts Under Non-Equity Incentive Plan Awards | Estimated Future Payouts Under Equity Incentive Plan Awards | All Other Stock Awards: Number of Shares of Stock or Units (#)(4) | All Other Option Awards: Number of Securities Underlying Options (#)(5) | Exercise or Base Price of Option Awards ($/Sh) | Grant Date Fair Value of Stock and Option Awards | |||||||||||||||||||||||||
| Target ($) | Maximum ($) | Target | Maximum | |||||||||||||||||||||||||||||
| W. Rodney | $ | 1,625,962 | (1) | $ | 3,251,924 | (1) | ||||||||||||||||||||||||||
| McMullen | $ | 600,000 | (2) | $ | 1,200,000 | (2) | ||||||||||||||||||||||||||
| 7/15/2015 | 86,095 | $ | 3,300,021 | |||||||||||||||||||||||||||||
| 7/15/2015 | 235,415 | $ | 38.33 | $ | 2,300,092 | |||||||||||||||||||||||||||
| 7/15/2015 | 26,090 | (3) | 52,179 | (3) | $ | 1,032,231 | ||||||||||||||||||||||||||
| J. Michael | $ | 571,154 | (1) | $ | 1,142,308 | (1) | ||||||||||||||||||||||||||
| Schlotman | $ | 380,000 | (2) | $ | 760,000 | (2) | ||||||||||||||||||||||||||
| 7/15/2015 | 38,610 | $ | 1,479,921 | |||||||||||||||||||||||||||||
| 9/17/2015 | 13,334 | $ | 500,025 | |||||||||||||||||||||||||||||
| 7/15/2015 | 106,531 | $ | 38.33 | $ | 1,040,847 | |||||||||||||||||||||||||||
| 7/15/2015 | 12,870 | (3) | 25,740 | (3) | $ | 509,202 | ||||||||||||||||||||||||||
| Michael J. | $ | 571,154 | (1) | $ | 1,142,308 | (1) | ||||||||||||||||||||||||||
| Donnelly | $ | 331,450 | (2) | $ | 662,900 | (2) | ||||||||||||||||||||||||||
| 7/15/2015 | 29,547 | $ | 1,132,537 | |||||||||||||||||||||||||||||
| 9/17/2015 | 13,334 | $ | 500,025 | |||||||||||||||||||||||||||||
| 7/15/2015 | 59,929 | $ | 38.33 | $ | 585,529 | |||||||||||||||||||||||||||
| 7/15/2015 | 7,240 | (3) | 14,480 | (3) | $ | 286,451 | ||||||||||||||||||||||||||
| Christopher T. | $ | 571,154 | (1) | $ | 1,142,308 | (1) | ||||||||||||||||||||||||||
| Hjelm | $ | 310,000 | (2) | $ | 620,000 | (2) | ||||||||||||||||||||||||||
| 7/15/2015 | 28,960 | $ | 1,110,037 | |||||||||||||||||||||||||||||
| 9/17/2015 | 13,334 | $ | 500,025 | |||||||||||||||||||||||||||||
| 7/15/2015 | 79,898 | $ | 38.33 | $ | 780,633 | |||||||||||||||||||||||||||
| 7/15/2015 | 9,654 | (3) | 19,307 | (3) | $ | 381,941 | ||||||||||||||||||||||||||
| Frederick J. | $ | 577,769 | (1) | $ | 1,155,538 | (1) | ||||||||||||||||||||||||||
| Morganthall II | $ | 285,117 | (2) | $ | 570,234 | (2) | ||||||||||||||||||||||||||
| 7/15/2015 | 23,609 | $ | 904,933 | |||||||||||||||||||||||||||||
| 9/17/2015 | 13,334 | $ | 500,025 | |||||||||||||||||||||||||||||
| 7/15/2015 | 39,959 | $ | 38.33 | $ | 390,414 | |||||||||||||||||||||||||||
| 7/15/2015 | 4,827 | (3) | 9,653 | (3) | $ | 190,960 | ||||||||||||||||||||||||||
| (1) | These amounts relate to the 2015 performance-based annual cash bonus plan. The amount listed under “Target” represents the annual cash bonus potential of the NEO. By the terms of the plan, payouts are limited to no more than 200% of a participant’s annual cash bonus potential; accordingly, the amount listed under “Maximum” equals two times that officer’s annual cash bonus potential amount. In the event that a participant’s annual cash bonus potential is |
37
| (2) | These amounts relate to the long-term cash bonus potential issued under 2015 Long-Term Incentive Plan, which covers performance during fiscal years 2015, 2016 and 2017. The long-term cash bonus potential amount equals the annual base salary of the NEOs as of the last day of fiscal 2014 (or date of plan entry, if later). By the terms of the plan, payouts are limited to no more than 100% of a participant’s long-term cash bonus potential; accordingly, the amount listed under “Maximum” equals the participant’s long-term cash bonus potential. Because the actual payout is based on the level of performance achieved, the target amount is not determinable and therefore the amount listed under “Target” is a representative amount based on the probable outcome of the performance conditions. | |
| (3) | These amounts | |
32
| The | ||
| (4) | These amounts represent the number of shares of restricted stock granted in 2015. The aggregate grant date fair value reported in the last column is calculated in accordance with FASB ASC Topic 718. The | |
33
| Long-Term | Dividend | Dividends | |||||||||||||||||||
| Accidental Death | Disability | Equivalent | on Unvested | ||||||||||||||||||
| Life Insurance | and Dismemberment | Insurance | Payments on | Restricted | |||||||||||||||||
| Premium | Insurance Premium | Premium | Performance Units | Stock | |||||||||||||||||
| Mr. Dillon | $ | 187,652 | $228 | — | $ | 76,430 | $ | 195,274 | |||||||||||||
| Mr. McMullen | $ | 48,227 | $228 | $ | 2,778 | $ | 24,643 | $ | 90,453 | ||||||||||||
| Mr. Schlotman | $ | 42,242 | $228 | — | $ | 12,300 | $ | 30,406 | |||||||||||||
| Ms. Barclay | $ | 112,157 | $228 | — | $ | 8,904 | $ | 23,664 | |||||||||||||
| Mr. Heldman | $ | 108,359 | $228 | $ | 2,778 | $ | 11,696 | $ | 33,123 | ||||||||||||
| Mr. Ellis | $ | 33,982 | $228 | $ | 2,229 | $ | 5,929 | $ | 21,964 | ||||||||||||
Grants of Plan-Based Awards
The following table provides information about equity and non-equity awards granted to the named executive officers in 2013:
| All Other | All Other | |||||||||||||||||||||||||||||||||||||||
| Stock | Option | |||||||||||||||||||||||||||||||||||||||
| Estimated Future | Estimated Future | Awards: | Awards: | Exercise | Grant | |||||||||||||||||||||||||||||||||||
| Payouts Under | Payouts Under | Number | Number of | or Base | Date Fair | |||||||||||||||||||||||||||||||||||
| Non-Equity | Equity Incentive | of Shares | Securities | Price of | Value of | |||||||||||||||||||||||||||||||||||
| Incentive Plan Awards | Plan Awards | of Stock | Underlying | Option | Stock and | |||||||||||||||||||||||||||||||||||
| Grant | Target | Maximum | Target | Maximum | or Units | Options | Awards | Option | ||||||||||||||||||||||||||||||||
| Name | Date | ($) | ($) | (#) | (#) | (#) | (#) | ($/Sh) | Awards | |||||||||||||||||||||||||||||||
| (3) | (4) | |||||||||||||||||||||||||||||||||||||||
| David B. Dillon | $ | 1,500,000 | (1) | $ | 3,000,000 | (1) | ||||||||||||||||||||||||||||||||||
| $ | 665,000 | (2) | $ | 1,330,000 | (2) | |||||||||||||||||||||||||||||||||||
| 7/15/2013 | 111,968 | $ | 4,227,912 | |||||||||||||||||||||||||||||||||||||
| 7/15/2013 | 298,580 | $ | 37.76 | $ | 2,781,910 | |||||||||||||||||||||||||||||||||||
| 7/15/2013 | 37,323 | (5) | 74,645 | (5) | $ | 1,481,517 | (5) | |||||||||||||||||||||||||||||||||
| W. Rodney McMullen | $ | 1,000,000 | (1) | $ | 2,000,000 | (1) | ||||||||||||||||||||||||||||||||||
| $ | 469,800 | (2) | $ | 939,600 | (2) | |||||||||||||||||||||||||||||||||||
| 7/15/2013 | 36,540 | $ | 1,379,750 | |||||||||||||||||||||||||||||||||||||
| 12/12/2013 | 80,000 | $ | 3,199,200 | |||||||||||||||||||||||||||||||||||||
| 7/15/2013 | 97,440 | $ | 37.76 | $ | 907,862 | |||||||||||||||||||||||||||||||||||
| 7/15/2013 | 12,180 | (5) | 24,360 | (5) | $ | 483,485 | (5) | |||||||||||||||||||||||||||||||||
| J. Michael Schlotman | $ | 550,000 | (1) | $ | 1,100,000 | (1) | ||||||||||||||||||||||||||||||||||
| $ | 335,550 | (2) | $ | 671,100 | (2) | |||||||||||||||||||||||||||||||||||
| 7/15/2013 | 20,490 | $ | 773,702 | |||||||||||||||||||||||||||||||||||||
| 12/12/2013 | 13,000 | $ | 519,870 | |||||||||||||||||||||||||||||||||||||
| 7/15/2013 | 54,640 | $ | 37.76 | $ | 509,088 | |||||||||||||||||||||||||||||||||||
| 7/15/2013 | 6,830 | (5) | 13,660 | (5) | $ | 271,117 | (5) | |||||||||||||||||||||||||||||||||
| Kathleen S. Barclay | $ | 550,000 | (1) | $ | 1,100,000 | (1) | ||||||||||||||||||||||||||||||||||
| $ | 338,500 | (2) | $ | 677,300 | (2) | |||||||||||||||||||||||||||||||||||
| 7/15/2013 | 20,000 | $ | 755,200 | |||||||||||||||||||||||||||||||||||||
| 12/17/2013 | 13,000 | $ | 517,790 | |||||||||||||||||||||||||||||||||||||
| 7/15/2013 | 33,040 | $ | 37.76 | $ | 307,838 | |||||||||||||||||||||||||||||||||||
| 7/15/2013 | 4,130 | (5) | 8,260 | (5) | $ | 163,940 | (5) | |||||||||||||||||||||||||||||||||
34
Estimated Future Payouts Under Non-Equity Incentive Plan Awards | Estimated Future Payouts Under Equity Incentive Plan Awards | All Other Stock Awards: Number of Shares of Stock or Units (#) | All Other Option Awards: Number of Securities Underlying Options (#) | Exercise or Base Price of Option Awards ($/Sh) | Grant Date Fair Value of Stock and Option Awards | |||||||||||||||||||||||
| Name | Grant Date | Target ($) | Maximum ($) | Target (#) | Maximum (#) | |||||||||||||||||||||||
| (3) | (4) | |||||||||||||||||||||||||||
| Paul W. Heldman | $ | 550,000 | (1) | $ | 1,100,000 | (1) | ||||||||||||||||||||||
| $ | 381,500 | (2) | $ | 763,000 | (2) | |||||||||||||||||||||||
| 7/15/2013 | 18,525 | $ | 699,504 | |||||||||||||||||||||||||
| 7/15/2013 | 49,400 | $37.76 | $ | 460,267 | ||||||||||||||||||||||||
| 7/15/2013 | 6,175 | (5) | 12,350 | (5) | $ | 245,117 | (5) | |||||||||||||||||||||
| Michael L. Ellis | $ | 375,000 | (1) | $ | 750,000 | (1) | ||||||||||||||||||||||
| $ | 256,000 | (2) | $ | 512,000 | (2) | |||||||||||||||||||||||
| 7/15/2013 | 9,510 | $ | 359,098 | |||||||||||||||||||||||||
| 12/12/2013 | 25,000 | $ | 999,750 | |||||||||||||||||||||||||
| 7/15/2013 | 25,360 | $37.76 | $ | 236,283 | ||||||||||||||||||||||||
| 7/15/2013 | 3,170 | (5) | 6,340 | (5) | $ | 125,833 | (5) | |||||||||||||||||||||
35
The Compensation Committee, and the independent members of the Board in the case of the CEO, established the bonus potentials shown in this table as “target”“Target” amounts for the performance-based annual cash bonus awards, and established the amounts shown in this table as “Maximum” amounts for the long-term cash bonus awards forand the named executive officers.performance unit awards. Amounts wereare payable to the extent that performance metmeets specific objectivesperformance goals established by the Compensation Committee at the beginning of the performance period. As described in the Compensation Discussion and Analysis, actual earnings under the annual performance-based cash bonus canplan may exceed the target amountsamount if the Company’s performance exceeds the thresholds.performance goals, but are limited to 200% of the target amount. The Compensation Committee, and the independent members of the Board in the case of the CEO, also determined the number of performance units to be awarded to each named executive officer,NEO, under which common shares are earned to the extent performance meets specific objectives established at the beginning of the performance period. The performance units and the long-term cash bonus awards are more particularly described in the Compensation Discussion and Analysis.
Restrictions on restricted stock awards madeawarded to the named executive officersNEOs normally lapse, so long as the officer is then in our employ, in equal amounts on each of the first five anniversaries of the grant date, except that the awards granted to Messrs. Schlotman, Donnelly, Hjelm and Morganthall on 9/17/2015 and 9,132 shares of the award is made, except that: 70,000 shares awardedgranted to Mr. McMullen in 2009 vest as follows: 15,000 sharesMorganthall on 6/25/2012, 20,000 shares on 6/25/2013, and 35,000 shares on 6/25/2014; 111,986 shares awarded to Mr. Dillon in 20127/15/15 vest in equal amounts on each of the four anniversaries of the date the award was made; 13,000 shares awarded to Mr. Schlotman in 2013 vest as follows: 3,250 shares on each of 12/12/2014 and 12/12/2015 and 6,500 shares on 12/12/16; 18,000 shares awarded to Ms. Barclay in 2012 vest in equal amounts on each of thefirst three anniversaries of the date the award was made; 20,000 shares awarded to Ms. Barclay in 2013 vest in equal amounts on each of the two anniversaries of the date the award was made; 13,000 awarded to Ms. Barclay in 2013 vest as follows: 3,250 shares on each of 12/17/2014 and 12/17/ 2015 and 6,500 shares on 12/17/2016; 10,000 shares awarded to Mr. Ellis in 2012 vest in equal amounts on each of the three anniversaries of the date the award was made; and 6,667 shares awarded to Mr. Ellis in 2013 vest in equal amounts on each of the two anniversaries of the date the award was made. For grants made to the named executive officers in 2013, the restrictions continue to lapse following retirement if the following criteria are met: the officer is employed for at least one year after the grant of the restricted stock, has at least 5 years of service, has attained the age of 62, and does not provide services to a competitor of ours.date. Any dividends declared on Kroger common shares are payable on unvested restricted stock. Nonqualified stock options granted to the named executive officersNEOs normally vest, so long as the officer is then in our employ, in equal amounts on each of the first five anniversaries of the date of grant.grant date.
3638
2015 Outstanding Equity Awards at Fiscal Year-End
The following table disclosesprovides information about outstanding equity-based incentive compensation awards for the named executive officersNEOs as of the end of fiscal year 2013. Each outstanding award is shown separately.2015. The vesting schedule for each award is described in the footnotes to this table. MarketThe market value of unvested sharesrestricted stock and unearned performance units is based on Kroger’sthe closing stock price of $36.10Kroger’s common shares of $38.81 on January 31, 2014,29, 2016, the last trading day of the 2013 fiscal year.2015.
Option Awards | Stock Awards | |||||||||||||||||||||||||||||||||||||
| Name | Number of Securities Underlying Unexercised Options (#) Exercisable | Number of Securities Underlying Unexercised Options (#) Unexercisable | Equity Incentive Plan Awards: Number of Securities Underlying Unexercised Unearned Options (#) | Option Exercise Price ($) | Option Expiration Date | Number of Shares or Units of Stock That Have Not Vested (#) | Market Value of Shares or Units of Stock That Have Not Vested ($) | Equity Incentive Plan Awards: Number of Unearned Shares, Units or Other Rights That Have Not Vested | Equity Incentive Plan Awards: Market or Payout Value of Unearned Shares, Units or Other Rights That Have Not Vested | |||||||||||||||||||||||||||||
| David B. Dillon | 300,000 | $ | 16.39 | 5/5/2015 | 23,000 | (6) | $ | 830,300 | ||||||||||||||||||||||||||||||
| 240,000 | $ | 19.94 | 5/4/2016 | 34,500 | (7) | $ | 1,245,450 | |||||||||||||||||||||||||||||||
| 220,000 | $ | 28.27 | 6/28/2017 | 63,810 | (8) | $ | 2,303,541 | |||||||||||||||||||||||||||||||
| 225,000 | $ | 28.61 | 6/26/2018 | 83,976 | (9) | $ | 3,031,534 | |||||||||||||||||||||||||||||||
| 180,000 | 45,000 | (1) | $ | 22.34 | 6/25/2019 | 111,968 | (10) | $ | 4,042,045 | |||||||||||||||||||||||||||||
| 138,000 | 92,000 | (2) | $ | 20.16 | 6/24/2020 | 52,998 | (18) | $ | 2,007,032 | |||||||||||||||||||||||||||||
| 113,440 | ||||||||||||||||||||||||||||||||||||||
| 170,160 | (3) | $ | 24.74 | 6/23/2021 | 37,323 | (19) | $ | 1,419,561 | ||||||||||||||||||||||||||||||
| 59,716 | 238,864 | (4) | $ | 21.96 | 7/12/2022 | |||||||||||||||||||||||||||||||||
| 298,580 | (5) | $ | 37.76 | 7/15/2023 | ||||||||||||||||||||||||||||||||||
| W. Rodney McMullen | 75,000 | $ | 17.31 | 5/6/2014 | 35,000 | (6) | $ | 1,263,500 | ||||||||||||||||||||||||||||||
| 75,000 | $ | 16.39 | 5/5/2015 | 7,000 | (6) | $ | 252,700 | |||||||||||||||||||||||||||||||
| 60,000 | $ | 19.94 | 5/4/2016 | 10,500 | (7) | $ | 379,050 | |||||||||||||||||||||||||||||||
| 60,000 | $ | 28.27 | 6/28/2017 | 20,574 | (8) | $ | 742,721 | |||||||||||||||||||||||||||||||
| 65,000 | $ | 28.61 | 6/26/2018 | 29,232 | (11) | $ | 1,055,275 | |||||||||||||||||||||||||||||||
| 52,000 | 13,000 | (1) | $ | 22.34 | 6/25/2019 | 36,540 | (10) | $ | 1,319,094 | |||||||||||||||||||||||||||||
| 42,000 | 28,000 | (2) | $ | 20.16 | 6/24/2020 | 80,000 | (13) | $ | 2,888,000 | |||||||||||||||||||||||||||||
| 36,576 | 54,864 | (3) | $ | 24.74 | 6/23/2021 | 17,296 | (18) | $ | 654,984 | |||||||||||||||||||||||||||||
| 19,488 | 77,952 | (4) | $ | 21.96 | 7/12/2022 | 12,180 | (19) | $ | 463,266 | |||||||||||||||||||||||||||||
| 97,440 | (5) | $ | 37.76 | 7/15/2023 | ||||||||||||||||||||||||||||||||||
| J. Michael Schlotman | 20,000 | $ | 19.94 | 5/4/2016 | 2,000 | (6) | $ | 72,200 | ||||||||||||||||||||||||||||||
| 20,000 | $ | 28.27 | 6/28/2017 | 3,750 | (7) | $ | 135,375 | |||||||||||||||||||||||||||||||
| 20,000 | $ | 28.61 | 6/26/2018 | 10,269 | (8) | $ | 370,711 | |||||||||||||||||||||||||||||||
| 16,000 | 4,000 | (1) | $ | 22.34 | 6/25/2019 | 16,392 | (11) | $ | 591,751 | |||||||||||||||||||||||||||||
| 15,000 | 10,000 | (2) | $ | 20.16 | 6/24/2020 | 20,490 | (10) | $ | 739,689 | |||||||||||||||||||||||||||||
| 18,256 | 27,384 | (3) | $ | 24.74 | 6/23/2021 | 13,000 | (12) | $ | 469,300 | |||||||||||||||||||||||||||||
| 10,928 | 43,712 | (4) | $ | 21.96 | 7/12/2022 | 9,699 | (18) | $ | 367,286 | |||||||||||||||||||||||||||||
| 54,640 | (5) | $ | 37.76 | 7/15/2023 | 6,830 | (19) | $ | 259,779 | ||||||||||||||||||||||||||||||
| Kathleen S. Barclay | 25,000 | $ | 20.06 | 12/10/2019 | 3,750 | (7) | $ | 135,375 | ||||||||||||||||||||||||||||||
| 15,000 | 10,000 | (2) | $ | 20.16 | 6/24/2020 | 7,434 | (8) | $ | 268,367 | |||||||||||||||||||||||||||||
| 13,216 | 19,824 | (3) | $ | 24.74 | 6/23/2021 | 12,000 | (14) | $ | 433,200 | |||||||||||||||||||||||||||||
| 6,608 | 26,432 | (4) | $ | 21.96 | 7/12/2022 | 20,000 | (15) | $ | 722,000 | |||||||||||||||||||||||||||||
| 33,040 | (5) | $ | 37.76 | 7/15/2023 | 13,000 | (16) | $ | 469,300 | ||||||||||||||||||||||||||||||
| 5,865 | (18) | $ | 222,092 | |||||||||||||||||||||||||||||||||||
| 4,130 | (19) | $ | 157,085 | |||||||||||||||||||||||||||||||||||
| Option Awards | Stock Awards | |||||||||||||||||||||||||||||||||||||
| Name | Number of Securities Underlying Unexercised Options Exercisable (#) | Number of | Option | Option Expiration Date | Number of Shares or Units of Stock That Have Not Vested (#) | Market Value | Equity Incentive Plan Awards: Number of Unearned Shares, Units or Other Rights That Have Not Vested (#) | Equity | ||||||||||||||||||||||||||||||
| W. Rodney | 120,000 | — | $ | 9.97 | 5/4/2016 | 13,716 | (6) | 532,318 | 73,875 | (16) | 2,952,414 | (16) | ||||||||||||||||||||||||||
| McMullen | 120,000 | — | $ | 14.14 | 6/28/2017 | 29,232 | (7) | 1,134,494 | 26,090 | (17) | 1,044,754 | (17) | ||||||||||||||||||||||||||
| 130,000 | — | $ | 14.31 | 6/26/2018 | 43,848 | (8) | 1,701,741 | |||||||||||||||||||||||||||||||
| 130,000 | — | $ | 11.17 | 6/25/2019 | 96,000 | (9) | 3,725,760 | |||||||||||||||||||||||||||||||
| 140,000 | — | $ | 10.08 | 6/24/2020 | 90,000 | (10) | 3,492,900 | |||||||||||||||||||||||||||||||
| 146,304 | 36,576 | (1) | $ | 12.37 | 6/23/2021 | 86,095 | (11) | 3,341,347 | ||||||||||||||||||||||||||||||
| 116,928 | 77,952 | (2) | $ | 10.98 | 7/12/2022 | |||||||||||||||||||||||||||||||||
| 77,952 | 116,928 | (3) | $ | 18.88 | 7/15/2023 | |||||||||||||||||||||||||||||||||
| 60,000 | 240,000 | (4) | $ | 24.67 | 7/15/2024 | |||||||||||||||||||||||||||||||||
| — | 235,415 | (5) | $ | 38.33 | 7/15/2025 | |||||||||||||||||||||||||||||||||
| J. Michael | 50,000 | — | $ | 10.08 | 6/24/2020 | 6,846 | (6) | 265,693 | 19,700 | (16) | 787,311 | (16) | ||||||||||||||||||||||||||
| Schlotman | 73,024 | 18,256 | (1) | $ | 12.37 | 6/23/2021 | 16,392 | (7) | 636,174 | 12,870 | (17) | 515,379 | (17) | |||||||||||||||||||||||||
| 65,568 | 43,712 | (2) | $ | 10.98 | 7/12/2022 | 24,588 | (8) | 954,260 | ||||||||||||||||||||||||||||||
| 43,712 | 65,568 | (3) | $ | 18.88 | 7/15/2023 | 13,000 | (12) | 504,530 | ||||||||||||||||||||||||||||||
| 16,000 | 64,000 | (4) | $ | 24.67 | 7/15/2024 | 16,000 | (13) | 620,960 | ||||||||||||||||||||||||||||||
| — | 106,531 | (5) | $ | 38.33 | 7/15/2025 | 24,000 | (10) | 931,440 | ||||||||||||||||||||||||||||||
| 38,610 | (11) | 1,498,454 | ||||||||||||||||||||||||||||||||||||
| 13,334 | (14) | 517,493 | ||||||||||||||||||||||||||||||||||||
| Michael J. | 40,000 | — | $ | 14.14 | 6/28/2017 | 4,804 | (6) | 186,443 | 14,775 | (16) | 590,483 | (16) | ||||||||||||||||||||||||||
| Donnelly | 40,000 | — | $ | 14.31 | 6/26/2018 | 7,608 | (7) | 295,266 | 7,240 | (17) | 289,926 | (17) | ||||||||||||||||||||||||||
| 40,000 | — | $ | 11.17 | 6/25/2019 | 14,412 | (8) | 559,330 | |||||||||||||||||||||||||||||||
| 40,000 | — | $ | 10.08 | 6/24/2020 | 13,000 | (12) | 504,530 | |||||||||||||||||||||||||||||||
| 56,576 | 14,144 | (1) | $ | 12.37 | 6/23/2021 | 18,000 | (10) | 698,580 | ||||||||||||||||||||||||||||||
| 30,432 | 20,288 | (2) | $ | 10.98 | 7/12/2022 | 29,547 | (11) | 1,146,719 | ||||||||||||||||||||||||||||||
| 20,288 | 30,432 | (3) | $ | 18.88 | 7/15/2023 | 13,334 | (14) | 517,493 | ||||||||||||||||||||||||||||||
| 12,000 | 48,000 | (4) | $ | 24.67 | 7/15/2024 | |||||||||||||||||||||||||||||||||
| — | 59,929 | (5) | $ | 38.33 | 7/15/2025 | |||||||||||||||||||||||||||||||||
| Christopher T. | 8,000 | — | $ | 14.31 | 6/26/2018 | 3,804 | (6) | 147,633 | 14,775 | (16) | 590,483 | (16) | ||||||||||||||||||||||||||
| Hjelm | 16,000 | — | $ | 11.17 | 6/25/2019 | 7,608 | (7) | 295,266 | 9,654 | (17) | 386,574 | (17) | ||||||||||||||||||||||||||
| 24,000 | — | $ | 10.08 | 6/24/2020 | 11,412 | (8) | 442,900 | |||||||||||||||||||||||||||||||
| 30,432 | 10,144 | (1) | $ | 12.37 | 6/23/2021 | 13,000 | (12) | 504,530 | ||||||||||||||||||||||||||||||
| 30,432 | 20,288 | (2) | $ | 10.98 | 7/12/2022 | 18,000 | (10) | 698,580 | ||||||||||||||||||||||||||||||
| 20,288 | 30,432 | (3) | $ | 18.88 | 7/15/2023 | 28,960 | (11) | 1,123,938 | ||||||||||||||||||||||||||||||
| 12,000 | 48,000 | (4) | $ | 24.67 | 7/15/2024 | 13,334 | (14) | 517,493 | ||||||||||||||||||||||||||||||
| — | 79,898 | (5) | $ | 38.33 | 7/15/2025 | |||||||||||||||||||||||||||||||||
| Frederick J. | — | 39,959 | (5) | $ | 38.33 | 7/15/2025 | 75,778 | (15) | 2,940,944 | 13,445 | (16) | 537,339 | (16) | |||||||||||||||||||||||||
| Morganthall II | 34,710 | (10) | 1,347,095 | 4,827 | (17) | 193,277 | (17) | |||||||||||||||||||||||||||||||
| 9,132 | (8) | 354,413 | ||||||||||||||||||||||||||||||||||||
| 14,477 | (11) | 561,852 | ||||||||||||||||||||||||||||||||||||
| 13,334 | (14) | 517,493 | ||||||||||||||||||||||||||||||||||||
3739
Option Awards | Stock Awards | |||||||||||||||||||||||||||||||||
| Name | Number of Securities Underlying Unexercised Options (#) Exercisable | Number of Securities Underlying Unexercised Options (#) Unexercisable | Equity Incentive Plan Awards: Number of Securities Underlying Unexercised Unearned Options (#) | Option Exercise Price ($) | Option Expiration Date | Number of Shares or Units of Stock That Have Not Vested (#) | Market Value of Shares or Units of Stock That Have Not Vested ($) | Equity Incentive Plan Awards: Number of Unearned Shares, Units or Other Rights That Have Not Vested | Equity Incentive Plan Awards: Market or Payout Value of Unearned Shares, Units or Other Rights That Have Not Vested | |||||||||||||||||||||||||
| Paul W. Heldman | 25,000 | $ | 19.94 | 5/4/2016 | 2,500 | (6) | $ | 90,250 | ||||||||||||||||||||||||||
| 25,000 | $ | 28.27 | 6/28/2017 | 4,500 | (7) | $ | 162,450 | |||||||||||||||||||||||||||
| 25,000 | $ | 28.61 | 6/26/2018 | 9,765 | (8) | $ | 352,517 | |||||||||||||||||||||||||||
| 20,000 | 5,000 | (1) | $ | 22.34 | 6/25/2019 | 14,820 | (11) | $ | 535,002 | |||||||||||||||||||||||||
| 18,000 | 12,000 | (2) | $ | 20.16 | 6/24/2020 | 18,525 | (10) | $ | 668,753 | |||||||||||||||||||||||||
| 17,360 | 26,040 | (3) | $ | 24.74 | 6/23/2021 | 8,769 | (18) | $ | 332,063 | |||||||||||||||||||||||||
| 9,880 | 39,520 | (4) | $ | 21.96 | 7/12/2022 | 6,175 | (19) | $ | 234,866 | |||||||||||||||||||||||||
| 49,400 | (5) | $ | 37.76 | 7/15/2023 | ||||||||||||||||||||||||||||||
| Michael L. Ellis | 15,000 | $ | 19.94 | 5/4/2016 | 2,000 | (6) | $ | 72,200 | ||||||||||||||||||||||||||
| 20,000 | $ | 28.27 | 6/28/2017 | 3,000 | (7) | $ | 108,300 | |||||||||||||||||||||||||||
| 20,000 | $ | 28.61 | 6/26/2018 | 4,950 | (8) | $ | 178,695 | |||||||||||||||||||||||||||
| 16,000 | 4,000 | (1) | $ | 22.34 | 6/25/2019 | 6,600 | (11) | $ | 238,260 | |||||||||||||||||||||||||
| 12,000 | 8,000 | (2) | $ | 20.16 | 6/24/2020 | 6,667 | (17) | $ | 240,679 | |||||||||||||||||||||||||
| 8,800 | 13,200 | (3) | $ | 24.74 | 6/23/2021 | 9,510 | (10) | $ | 343,311 | |||||||||||||||||||||||||
| 4,400 | 17,600 | (4) | $ | 21.96 | 7/12/2022 | 25,000 | (13) | $ | 902,500 | |||||||||||||||||||||||||
| 25,360 | (5) | $ | 37.76 | 7/15/2023 | ||||||||||||||||||||||||||||||
| 3,905 | (18) | $ | 147,882 | |||||||||||||||||||||||||||||||
| 3,170 | (19) | $ | 120,571 | |||||||||||||||||||||||||||||||
| (1) | Stock options vest on 6/ | |
| (2) | ||
| Stock options vest in equal amounts on 7/12/ | ||
| (3) | Stock options vest in equal amounts on | |
| Stock options vest in equal amounts on 7/15/2016, 7/15/2017, 7/15/2018 and 7/15/2019. | ||
| (5) | Stock options vest in equal amounts on 7/15/2016, 7/15/2017, 7/15/2018, 7/15/2019 and 7/15/2020. | |
| (6) | Restricted stock vests on | |
| (7) | Restricted stock vests in equal amounts on 7/12/ | |
| (8) | Restricted stock vests in equal amounts on | |
| (9) | Restricted stock vests in equal amounts on | |
| (10) | Restricted stock vests in equal amounts on 7/15/ | |
38
| (11) | Restricted stock vests in equal amounts on 7/15/2016, 7/15/2017, 7/15/2018, 7/15/2019 and 7/15/2020. | |
| (12) | Restricted stock vests on 12/12/2016. | |
| (13) | Restricted stock vests as follows: | |
| Restricted stock vests in equal amounts on 9/17/2016, 9/17/2017 and 9/17/2018. | ||
| (15) | Restricted stock vests in equal amounts on 1/30/2017, 1/30/2018 and 1/30/2019. | |
| (16) | Performance units granted under the | |
| (17) | Performance units granted under the | |
2015 Option Exercises and Stock Vested
The following table provides theinformation for 2015 regarding stock options exercised, and restricted stock vested, during 2013, as well asand common shares issued to the named executive officersNEOs pursuant to performance units awardedearned under the 2011 Long Term2013 Long-Term Incentive Plan.
2013 OPTION EXERCISES AND STOCK VESTED | ||||||||||||||||||
Option Awards(1) | Stock Awards(2) | |||||||||||||||||
| Name | Number of Shares Acquired on Exercise (#) | Value Realized on Exercise ($) | Number of Shares Acquired on Vesting (#) | Value Realized on Vesting ($) | ||||||||||||||
| David B. Dillon | — | — | 162,142 | $ | 6,103,134 | |||||||||||||
| W. Rodney McMullen | — | — | 69,418 | $ | 2,554,100 | |||||||||||||
| J. Michael Schlotman | 57,250 | $ | 1,370,567 | 21,383 | $ | 818,869 | ||||||||||||
| Kathleen S. Barclay | — | — | 16,135 | $ | 624,652 | |||||||||||||
| Paul W. Heldman | 80,000 | $ | 1,940,200 | 33,805 | $ | 1,242,360 | ||||||||||||
| Michael L. Ellis | 42,000 | $ | 890,220 | 15,983 | $ | 609,000 | ||||||||||||
| Option Awards(1) | Stock Awards(2) | |||||||||||||||||
| Name | Number of Shares Acquired on Exercise (#) | Value Realized on Exercise ($) | Number of Shares Acquired on Vesting (#) | Value Realized on Vesting ($) | ||||||||||||||
| W. Rodney McMullen | 150,000 | $ | 4,141,875 | 156,668 | $ | 6,019,970 | ||||||||||||
| J. Michael Schlotman | — | — | 70,808 | $ | 2,696,280 | |||||||||||||
| Michael J. Donnelly | 36,000 | $ | 1,124,280 | 43,426 | $ | 1,668,288 | ||||||||||||
| Christopher T. Hjelm | — | — | 41,426 | $ | 1,593,233 | |||||||||||||
| Frederick J. Morganthall II | — | — | 43,034 | $ | 1,656,157 | |||||||||||||
| (1) | ||
40
| (2) | The Stock Awards columns | |
| Vested Restricted Stock | Earned Performance Units | |||||||||||||
| Name | Number of Shares | Value Realized | Number of Shares | Value Realized | ||||||||||
| Mr. McMullen | 107,948 | $ | 4,181,764 | 48,720 | $ | 1,838,206 | ||||||||
| Mr. Schlotman | 43,488 | $ | 1,665,496 | 27,320 | $ | 1,030,784 | ||||||||
| Mr. Donnelly | 30,746 | $ | 1,189,872 | 12,680 | $ | 478,416 | ||||||||
| Mr. Hjelm | 28,746 | $ | 1,114,817 | 12,680 | $ | 478,416 | ||||||||
| Mr. Morganthall | 33,934 | $ | 1,312,814 | 9,100 | $ | 343,343 | ||||||||
Restricted stock. The table includes the number of shares acquired upon vesting of restricted stock and the value realized on the vesting of restricted stock.
Performance Units. In 2013, participants in the 2013 Long-Term Incentive Plan were awarded performance units that were earned based on performance criteria established by the Compensation Committee at the beginning of the three-year performance period. Actual payouts were based on the level of performance achieved, and were paid in common shares. The number of common shares issued and the value realized based on the closing price of Kroger common shares of $37.73 on March 10, 2016, the date of deemed delivery of the shares, are reflected in the table above.
39
2015 Pension Benefits
The following table provides information onregarding pension benefits for the NEOs as of 2013 year-end for the named executive officers.last day of 2015.
| Name | Plan Name | Number of Years Credited Service (#) | Present Value of Accumulated Benefit ($)(1) | ||||||||
| W. Rodney McMullen | Kroger Consolidated Retirement Benefit Plan | 30 | $ | 1,070,880 | |||||||
| Kroger Excess Benefit Plan | 30 | $ | 10,276,024 | ||||||||
| J. Michael Schlotman | Kroger Consolidated Retirement Benefit Plan | 30 | $ | 1,169,438 | |||||||
| Kroger Excess Benefit Plan | 30 | $ | 5,457,400 | ||||||||
| Michael J. Donnelly | Kroger Consolidated Retirement Benefit Plan | 36 | $ | 244,532 | |||||||
| Kroger Excess Benefit Plan | 36 | $ | 3,241,033 | ||||||||
| Christopher T. Hjelm | Kroger Consolidated Retirement Benefit Plan | — | (2) | $ | 10,086 | ||||||
| Frederick J. Morganthall II | Harris Teeter Employees’ Pension Plan | 29 | $ | 975,455 | |||||||
| Harris Teeter Supplemental Executive | |||||||||||
| Retirement Plan | 29 | $ | 8,044,875 | ||||||||
| (1) | The discount rate used to determine the present values was 4.66% for the Kroger and Dillon plans, 4.65% for the Harris Teeter Supermarkets, Inc. Employees’ Pension Plan (the “HT Pension Plan”) and 4.40% for the Harris Teeter Supermarkets, Inc. Supplemental Executive Retirement Plan (the “HT SERP”), which are the same rates used at the measurement date for financial reporting purposes. Additional assumptions used in calculating the present values are set forth in Note 15 to the consolidated financial statements in Kroger’s 10-K for 2015. |
| (2) | The benefits for cash balance participants are not based on years of credited service. See the narrative discussion following this table for a description of how plan benefits are determined. |
41
2013 PENSION BENEFITS | |||||||||
Name | Plan Name | Number of Years Credited Service (#) | Present Value of Accumulated Benefit ($) | Payments During Last Fiscal Year ($) | |||||
| David B. Dillon | The Kroger Consolidated Retirement Benefit Plan | 18 | $ | 753,266 | $0 | ||||
| The Kroger Co. Excess Benefit Plan | 18 | $ | 9,736,250 | $0 | |||||
| Dillon Companies, Inc. Excess Benefit Pension Plan | 20 | $ | 8,211,305 | $0 | |||||
| W. Rodney McMullen | The Kroger Consolidated Retirement Benefit Plan | 28 | $ | 802,528 | $0 | ||||
| The Kroger Co. Excess Benefit Plan | 28 | $ | 6,579,958 | $0 | |||||
| J. Michael Schlotman | The Kroger Consolidated Retirement Benefit Plan | 28 | $ | 899,195 | $0 | ||||
| The Kroger Co. Excess Benefit Plan | 28 | $ | 3,760,659 | $0 | |||||
| Paul W. Heldman | The Kroger Consolidated Retirement Benefit Plan | 31 | $ | 1,346,417 | $0 | ||||
| The Kroger Co. Excess Benefit Plan | 31 | $ | 6,867,111 | $0 | |||||
| Michael L. Ellis | The Kroger Consolidated Retirement Benefit Plan | 39 | $ | 90,301 | $0 | ||||
| The Kroger Co. Excess Benefit Plan | 39 | $ | 71,317 | $0 | |||||
Kroger Pension Plan and Excess Plan
Messrs. Dillon, McMullen, Schlotman, HeldmanDonnelly and EllisHjelm participate in The Kroger Consolidated Retirement Benefit Plan (the “Consolidated“Kroger Pension Plan”), which is a qualified defined benefit pension plan. Messrs. McMullen, Schlotman and Donnelly also participate in The ConsolidatedKroger Co. Excess Benefit Plan (the “Excess Plan”), which is a nonqualified deferred compensation plan as defined in Section 409A of the Internal Revenue Code. The purpose of the Excess Plan is to make up the shortfall in retirement benefits caused by the limitations on benefits to highly compensated individuals under the qualified defined benefit pension plans in accordance with the Internal Revenue Code.
Although participants generally receive credited service beginning at age 21, certain participants in the Kroger Pension Plan and the Excess Plan who commenced employment prior to 1986, including Messrs. McMullen and Schlotman, began to accrue credited service after attaining age 25 and one year of service. The Kroger Pension Plan and the Excess Plan generally determinesdetermine accrued benefits using a cash balance formula, but retainsretain benefit formulas applicable under prior plans for certain “grandfathered participants” who were employed by Kroger on December 31, 2000. Each of the above listed named executive officers, except for Mr. Ellis,Messrs. McMullen, Schlotman and Donnelly is eligible for these grandfathered benefits. Mr. Hjelm is not a grandfathered participant, and therefore, his benefits underare determined using the Consolidated Plan. Their benefits, therefore,cash balance formula.
Grandfathered Participants
Benefits for grandfathered participants are determined using formulas applicable under prior plans, including the Kroger formula covering service to The Kroger Co. and the Dillon Companies, Inc. Pension Plan formula covering service to Dillon Companies, Inc. While Mr. Ellis is also a participant in the Consolidated Plan, he is not a grandfathered participant, but is a participant in the cash balance formula.
As “grandfathered participants”, Messrs. Dillon, McMullen, Schlotman Heldman and Ellis also are eligible to receive benefits under The Kroger Co. Excess Benefit Plan (the “Kroger Excess Plan”), and Mr. Dillon is also eligible to receive benefits under the Dillon Companies, Inc. Excess Benefit Pension Plan (the “Dillon Excess Plan”). These plans are collectively referred to as the “Excess Plans.” The Excess Plans are each considered to be nonqualified deferred compensation plans as defined in Section 409A of the Internal Revenue Code. The purpose of the Excess Plans is to make up the shortfall in retirement benefits caused by the limitations on benefits to highly compensated individuals under qualified plans in accordance with the Internal Revenue Code.
Each of the above listed named executive officers, except for Mr. Ellis,Donnelly will receive benefits under the ConsolidatedKroger Pension Plan and the Excess Plans,Plan, determined as follows:
| ● | 1½% times years of credited service multiplied by the average of the highest five years of total earnings (base salary and annual cash bonus) during the last ten calendar years of employment, reduced by 1¼% times years of credited service multiplied by the primary social security benefit; |
| ● | normal retirement age is 65; |
| ● | unreduced benefits are payable beginning at age 62; and |
| ● | benefits payable between ages 55 and 62 will be reduced by⅓ of one percent for each of the first 24 months and by ½ of one percent for each of the next 60 months by which the commencement of benefits precedes age 62. |
40
Although participants generally receive credited service beginning at age 21, those participants who commenced employment prior to 1986, including the above listed named executive officers, began to accrue credited service after attaining age 25. In the event of a termination of employment Mr.other than death or disability, Messrs. McMullen, Schlotman and Donnelly currently isare eligible for a reduced early retirement benefit, as heeach has attained age 55. If a “grandfathered participant” becomes disabled while employed by Kroger and after attaining age 55, the participant will receive the full retirement benefit. If a married “grandfathered participant” dies while employed by Kroger, the surviving spouse will receive benefits as though a retirement occurred on such date, based on the greater of: actual benefits payable to the participant if he was over age 55, or the benefits that would have been payable to the participant assuming he was age 55 on the date of death.
Cash Balance Participants
Mr. Ellis,Hjelm began participating in the Kroger Pension Plan in August 2005 as a cash balance participant inparticipant. Until the Consolidated Plan, will receive benefits asplan was frozen on December 31, 2006, cash balance participants received an annual pay credit equal to 5% of that year’s eligible earnings withplus an annual interest accruing daily at a ratecredit equal to the account balance at the beginning of the plan year multiplied by the annual rate of interest on 30-year Treasury rate.Securities in effect prior to the plan year. Beginning on January 1, 2007, cash balance participants receive an annual interest credit but no longer receive an annual pay credit. Upon retirement, cash balance participants generally are eligible to receive a life annuity which is the actuarial equivalent of his account balance, but may elect in some circumstances to receive a lump sum distribution equal to his account balance. If Mr. Hjelm becomes disabled while employed by Kroger, he will receive the full retirement benefit. If he dies while employed by Kroger, his beneficiary will receive a death benefit equal to the benefit he was eligible to receive if a retirement occurred on such date.
42
Offsetting Benefits
Mr. DillonDonnelly also participates in the Dillon Companies, Inc. Employees’ Profit Sharing Plan, (the “Dillon Plan”). The Dillon Planwhich is a qualified defined contribution plan (the “Dillon Profit Sharing Plan”) under which Dillon Companies, Inc. and its participating subsidiaries may choose to make discretionary contributions each year that are then allocated to each participant’s account. Participation in the Dillon Profit Sharing Plan was frozen effective January 1, 2001. Benefits under the Dillon Plan do not continuein 2001 and participants are no longer able to accruemake employee contributions, but certain participants, including Mr. Donnelly, are still eligible for Mr. Dillon.employer contributions. Participants in the Dillon Plan elect from among a number of investment options and the amounts in their accounts are invested and credited with investment earnings in accordance with their elections. Prior to July 1, 2000, participants could elect to make voluntary contributions under the Dillon Plan, but that option was discontinued effective as of July 1, 2000. Participants can elect to receive their Dillon Plan benefit in the form of either a lump sum payment or installment payments.
Due to offset formulas contained in the Consolidated Plan and the Dillon ExcessKroger Pension Plan, Mr. Dillon’sDonnelly’s accrued benefits under the Dillon Profit Sharing Plan offset a portion of the benefit that would otherwise accrue for themhim under those plansthe Kroger Pension for theirhis service with Dillon Companies, Inc. Although benefits that accrue underThis offset is reflected in the table above.
Harris Teeter Pension Plan
Mr. Morganthall participates in the HT Pension Plan, which is a defined contribution plans are not reportablebenefit pension plan. Participation in the HT Pension Plan was frozen effective October 1, 2005. For participants with age and service points as of December 31, 2005 equal to or greater than 45, which includes Mr. Morganthall, benefit accruals under the accompanying table, we have added narrative disclosureHT Pension Plan after September 30, 2005 will be offset by the actuarial equivalent of the Dillonportion of their account balance under the Harris Teeter Supermarkets, Inc. Retirement and Savings Plan because(the “HT Savings Plan”) that are attributable to automatic retirement contributions made by Harris Teeter after September 30, 2005, plus earnings and losses on such contributions. A participant’s normal annual retirement benefit under the HT Pension Plan at age 65 is an amount equal to 0.8% of his final average earnings multiplied by years of service at retirement, plus 0.6% of his final average earnings in excess of Social Security covered compensation multiplied by the number of years of service up to a maximum of 35 years. A participant’s final average earnings is the average annual cash compensation paid to the participant during the plan year, including salary, incentive compensation and any amount contributed to the HT Savings Plan, for the 5 consecutive years in the last 10 years that produce the highest average.
Harris Teeter SERP
Mr. Morganthall also participates in the HT SERP, which is a nonqualified deferred compensation plan as defined in Section 409A of the offsetting effect thatInternal Revenue Code. The purpose of the HT SERP is to supplement the benefits under that plan has on benefits accruingpayable under the Consolidatedretirement plans. Under the HT SERP, participants who retire at normal retirement age of 60 receive monthly retirement benefits equal to between 55% and 60% of his final average earnings times his accrual fraction and reduced by his (1) assumed HT Pension Plan retirement benefit, and (2) assumed Social Security benefit. The final average earnings are the Dillon Excess Plan.
average annual earnings during the highest 3 calendar years out of the last 10 calendar years preceding termination of employment. The assumptions used in calculatingaccrual fraction is a fraction, the present values are set forth in Note 15 to the consolidated financial statements in Kroger’s Form 10-K for fiscal year 2013 ended February 1, 2014. The discount rate used to determine the present values is 4.99%,numerator of which is the same rate usedyears of credited service, the denominator of which is 20, and which may not exceed 1.0. The benefits payable under the HT SERP are payable for the participant’s lifetime with an automatic 75% survivor benefit payable to the participant’s surviving eligible spouse for his or her lifetime. Mr. Morganthall is eligible to receive the full benefit as he has reached age 60. Harris Teeter uses a non-qualified trust to purchase and hold the assets to satisfy Harris Teeter’s obligation under the HT SERP, and participants in the HT SERP are general creditors of Harris Teeter in the event Harris Teeter becomes insolvent.
43
2015 Nonqualified Deferred Compensation
The following table provides information on nonqualified deferred compensation for the NEOs for 2015.
| Name | Executive Contributions in Last FY | Registrant Contributions in Last FY | Aggregate Earnings in Last FY(1) | Aggregate Balance at Last FYE(2) | ||||||||||||||||||
| W. Rodney McMullen | $ | 7,500 | (3) | — | $ | 532,896 | $ | 8,379,170 | ||||||||||||||
| J. Michael Schlotman | — | — | — | — | ||||||||||||||||||
| Michael J. Donnelly | — | — | $ | 24,430 | $ | 372,649 | ||||||||||||||||
| Christopher T. Hjelm | $ | 148,808 | (4) | — | $ | 10,053 | $ | 236,885 | ||||||||||||||
| Frederick J. Morganthall II | $ | 100,000 | (4) | $ | 13,475 | (5) | — | $ | 663,852 | |||||||||||||
| (1) | These amounts include the aggregate earnings on all accounts for each NEO, including any above-market or preferential earnings. The following amounts earned in 2015 are deemed to be preferential earnings and are included in the “Change in Pension Value and Nonqualified Deferred Compensation Earnings” column of the Summary Compensation Table for 2015: Mr. McMullen, $80,092; Mr. Donnelly, $4,576; and Mr. Hjelm, $168. | |
| (2) | The following amounts in the Aggregate Balance column from the table were reported in the Summary Compensation Tables covering fiscal years 2006 – 2014: Mr. McMullen – $2,558,370; and Mr. Donnelly - $14,318. For Messrs. Hjelm and Morganthall, no portion of the Aggregate Balance from the table was reported in the Summary Compensation Table for prior years because they were not NEOs prior to 2015. | |
| (3) | This amount represents the deferral of a portion of his salary in 2015. This amount is included in the Summary Compensation Table for 2015. | |
| (4) | These amounts represent the deferral of a portion of the 2014 performance-based annual cash bonus earned in 2014 and paid in March 2015. | |
| (5) | This amount is included in the All Other Compensation column of the Summary Compensation Table for 2015. | |
Kroger Executive Deferred Compensation Plan
Messrs. McMullen, Donnelly and Hjelm participate in The Kroger Co. Executive Deferred Compensation Plan, which is a nonqualified deferred compensation plan. Participants may elect to defer up to 100% of the amount of their salary that exceeds the sum of the FICA wage base and pre-tax insurance and other Internal Revenue Code Section 125 plan deductions, as well as up to 100% of their annual and long-term cash bonus compensation. Kroger does not match any deferral or provide other contributions. Deferral account amounts are credited with interest at the measurementrate representing Kroger’s cost of ten-year debt as determined by Kroger’s CEO and approved by the Compensation Committee prior to the beginning of each deferral year. The interest rate established for deferral amounts for each deferral year will be applied to those deferral amounts for all subsequent years until the deferred compensation is paid out. Amounts deferred in 2015 earn interest at a rate of 3.65%. Participants can elect to receive lump sum distributions or quarterly installments for periods up to ten years. Participants also can elect between lump sum distributions and quarterly installments to be received by designated beneficiaries if the participant dies before distribution of deferred compensation is completed.
Participants may not withdraw amounts from their accounts until they leave Kroger, except that Kroger has discretion to approve an early distribution to a participant upon the occurrence of an unforeseen emergency. Participants who are “specified employees” under Section 409A of the Internal Revenue Code, which includes the NEOs, may not receive a post-termination distribution for at least six months following separation. If the employee dies prior to or during the distribution period, the remainder of the account will be distributed to his designated beneficiary in lump sum or quarterly installments, according to the participant’s prior election.
44
Harris Teeter Flexible Deferral Plan
Mr. Morganthall participates in the HT Flexible Deferral Plan, which is a nonqualified deferred compensation plan that provides certain highly compensated employees of Harris Teeter, the opportunity to defer the receipt and taxation on a portion of their annual compensation and supplements the benefits under tax qualified retirement plans to the extent that such benefits are subject to limitation under the Internal Revenue Code. Participants may elect to defer up to 50% of their base salary and up to 90% of their non-equity incentive bonus compensation. Harris Teeter provides matching contributions of 50% of the participant’s contribution, up to a maximum of 4% of the participant’s pay, less assumed matching contributions under the HT Savings Plan. These deferred amounts and Company match are credited to the participant’s account. Plan participants may choose deemed investments in the HT Flexible Deferral Plan that represent choices that span a variety of diversified asset classes. Participants may elect to receive a lump sum distribution, annual installment payments for 2-15 years, or a partial lump sum and installment payments. Upon retirement, death, disability, or other separation of service, the participant will receive distributions in accordance with his election, subject to limitations under Section 409A. Mr. Morganthall has reached the retirement age and is eligible for the full benefit. The HT Flexible Deferral Plan also allows for an in-service withdrawal for an unforeseeable emergency based on facts and circumstances that meet Internal Revenue Service and plan guidelines. Harris Teeter uses a non-qualified trust to purchase and hold the assets to satisfy Harris Teeter’s obligation under the HT Flexible Deferral Plan, and participants in the HT Flexible Deferral Plan are general creditors of Harris Teeter in the event Harris Teeter becomes insolvent.
Potential Payments upon Termination or Change in Control
Kroger does not have employment agreements or other contracts, agreements, plans or arrangements that provide for payments to the NEOs in connection with a termination of employment or a change in control of Kroger. However, KEPP, our award agreements for stock options, restricted stock and performance units and our long-term cash bonus plans provide for certain payments and benefits to participants, including the NEOs, in the event of a termination of employment or a change in control of Kroger, as described below. Our pension plans and nonqualified deferred compensation plan also provide for certain payments and benefits to participants in the event of a termination of employment, as described above in the Pension Benefits section and the Nonqualified Deferred Compensation section, respectively.
A “change in control” under KEPP, and our equity and non-equity incentive awards occurs if:
| ● | any person or entity (excluding Kroger’s employee benefit plans) acquires 20% or more of the voting power of Kroger; |
| ● | a merger, consolidation, share exchange, division, or other reorganization or transaction with Kroger results in Kroger’s voting securities existing prior to that event representing less than 60% of the combined voting power immediately after the event; |
| ● | Kroger’s shareholders approve a plan of complete liquidation or winding up of Kroger or an agreement for the sale or disposition of all or substantially all of Kroger’s assets; or |
| ● | during any period of 24 consecutive months, individuals at the beginning of the period who constituted Kroger’s Board of Directors cease for any reason to constitute at least a majority of the Board of Directors. |
KEPP
KEPP applies to all management employees and administrative support personnel who are not covered by a collective bargaining agreement, with at least one year of service, and provides severance benefits when a participant’s employment is terminated actually or constructively within two years following a change in control of Kroger, including the NEOs. The actual amount is dependent on pay level and years of service. The NEOs are eligible for the following benefits:
| ● | a lump sum severance payment equal to up to two times the sum of the participant’s annual base salary and 70% of the greater of the current annual cash bonus potential or the average of the actual annual cash bonus payments for the prior three years; |
45
| ● | a lump sum payment equal to the participant’s accrued and unpaid vacation, including banked vacation; |
| ● | a lump sum payment equal to 1/12th of the sum of the participant’s annual vacation pay plus 70% of the greater of the current year’s annual cash bonus potential or the average of the actual annual cash bonus payments for the prior three years, multiplied by the number of months elapsed in the current calendar year; |
| ● | continued medical and dental benefits for up to 24 months and continued life insurance coverage for up to 6 months; and |
| ● | up to $5,000 as reimbursement for eligible tuition expenses and up to $10,000 as reimbursement for eligible outplacement expenses. |
Payments to executive officers under KEPP will be reduced, to the extent necessary, so that payments will not exceed 2.99 times the officer’s average W-2 earnings over the preceding five years.
Long-Term Compensation Awards
The following table describes the treatment of long-term compensation awards following a termination of employment or change in control of Kroger. In each case, the continued vesting, exercisability or eligibility for the incentive awards will end if the participant provides services to a competitor of Kroger.
| Triggering Event | Stock Options | Restricted Stock | Performance Units | Performance-Based Long-Term Cash Bonus | |||
Involuntary | Forfeit all unvested options. Previously vested options remain exercisable for the shorter of one year after termination or the remainder of the original 10-year term. | Forfeit all unvested shares | Forfeit all rights to units for which the three year performance period has not ended | Forfeit all rights to long-term cash bonuses for which the three year performance period has not ended | |||
Voluntary - Prior to minimum | Forfeit all unvested options. Previously vested options remain exercisable for the shorter of one year after termination or the remainder of the original 10-year term. | Forfeit all unvested shares | Forfeit all rights to units for which the three year performance period has not ended | Forfeit all rights to long-term cash bonuses for which the three year performance period has not ended | |||
Voluntary - After minimum age | Unvested options continue vesting on the original schedule. All options are exercisable for remainder of the original 10-year term. | Forfeit all unvested shares granted prior to 2013. Vesting continues on the original schedule for awards granted during or after 2013. | Pro rata portion(1) of units earned based on performance results over the full three-year period | Pro rata portion(1) of long-term cash bonuses earned based on performance results over the full three-year period | |||
Death | Unvested options are immediately vested. All options are exercisable for remainder of the original 10-year term. | Unvested shares immediately vest | Pro rata portion(1) of units earned based on performance results through the end of the fiscal year in which death occurs. Award will be paid following the end of such fiscal year. | Pro rata portion(1) of long-term cash bonuses earned based on performance results through the end of the fiscal year in which death occurs. Award will be paid following the end of such fiscal year. | |||
Disability | Unvested options are immediately vested. All options are exercisable for remainder of the original 10-year term. | Unvested shares immediately vest | Pro rata portion(1) of units earned based on performance results over the full three-year period | Pro rata portion(1) of long-term cash bonuses earned based on performance results over the full three-year period | |||
Change in | Unvested options are immediately vested and exercisable | Unvested shares immediately vest | 50% of the maximum units granted at the beginning of the performance period earned immediately | 50% of the maximum bonus granted at the beginning of the performance period earned immediately |
46
| (1) | The prorated amount is equal to the number of weeks of active employment during the performance period divided by the total number of weeks in the performance period. | |
| (2) | The minimum age requirement is age 62 for stock options and restricted stock and age 55 for performance units and the long-term cash bonus. | |
| (3) | These benefits are payable upon a change in control of Kroger with or without a termination of employment. | |
Quantification of Payments upon Termination or Change in Control
The following table provides information regarding certain potential payments that would have been made to the NEOs if the triggering event occurred on the last day of the fiscal year, January 30, 2016, given compensation, age and service levels as of that date and, where applicable, based on the closing market price per Kroger common share on the last trading day of the fiscal year ($38.81 on January 29, 2016). Amounts actually received upon the occurrence of a triggering event will vary based on factors such as the timing during the year of such event, the market price of Kroger common shares, and the officer’s age, length of service and compensation levels.
| Name | Involuntary Termination | Voluntary Termination/ Retirement | Death | Disability | Change in Control without Termination | Change in | ||||||||||||||||
| W. Rodney McMullen | ||||||||||||||||||||||
| Accrued and Banked Vacation | $ | 763,072 | $ | 763,072 | $ | 763,072 | $ | 763,072 | $ | 763,072 | $ | 763,072 | ||||||||||
| Severance | — | — | — | — | — | 4,790,016 | ||||||||||||||||
| Additional Vacation and Bonus | — | — | — | — | — | 108,173 | ||||||||||||||||
| Continued Health and Welfare Benefits(1) | — | — | — | — | — | 58,326 | ||||||||||||||||
| Stock Options(2) | — | — | 8,973,448 | 8,973,448 | 8,973,448 | 8,973,448 | ||||||||||||||||
| Restricted Stock(3) | — | — | 13,928,560 | 13,928,560 | 13,928,560 | 13,928,560 | ||||||||||||||||
| Performance Units(4) | — | 2,615,463 | 2,615,463 | 2,615,463 | 2,467,908 | 2,467,908 | ||||||||||||||||
| Long-Term Cash Bonus(5) | — | 1,133,340 | 1,133,340 | 1,133,340 | 1,150,000 | 1,150,000 | ||||||||||||||||
| Executive Group Life Insurance | — | — | 4,910,000 | — | — | — | ||||||||||||||||
| J. Michael Schlotman | ||||||||||||||||||||||
| Accrued and Banked Vacation | $ | 516,928 | $ | 516,928 | $ | 516,928 | $ | 516,928 | $ | 516,928 | $ | 516,928 | ||||||||||
| Severance | — | — | — | — | — | 2,581,080 | ||||||||||||||||
| Additional Vacation and Bonus | — | — | — | — | — | 45,622 | ||||||||||||||||
| Continued Health and Welfare Benefits(1) | — | — | — | — | — | 48,995 | ||||||||||||||||
| Stock Options(2) | — | — | 3,962,059 | 3,962,059 | 3,962,059 | 3,962,059 | ||||||||||||||||
| Restricted Stock(3) | — | — | 5,929,004 | 5,929,004 | 5,929,004 | 5,929,004 | ||||||||||||||||
| Performance Units(4) | — | 850,471 | 850,471 | 850,471 | 887,585 | 887,585 | ||||||||||||||||
| Long-Term Cash Bonus(5) | — | 743,335 | 743,335 | 743,335 | 747,500 | 747,500 | ||||||||||||||||
| Executive Group Life Insurance | — | — | 3,064,200 | — | — | — | ||||||||||||||||
| Michael J. Donnelly | ||||||||||||||||||||||
| Accrued and Banked Vacation | $ | 245,191 | $ | 245,191 | $ | 245,191 | $ | 245,191 | $ | 245,191 | $ | 245,191 | ||||||||||
| Severance | — | — | — | — | — | 2,345,731 | ||||||||||||||||
| Additional Vacation and Bonus | — | — | — | — | — | 42,451 | ||||||||||||||||
| Continued Health and Welfare Benefits(1) | — | — | — | — | — | 38,794 | ||||||||||||||||
| Stock Options(2) | — | — | 2,252,578 | 2,252,578 | 2,252,578 | 2,252,578 | ||||||||||||||||
| Restricted Stock(3) | — | — | 3,908,361 | 3,908,361 | 3,908,361 | 3,908,361 | ||||||||||||||||
| Performance Units(4) | — | 575,422 | 575,422 | 575,422 | 572,059 | 572,059 | ||||||||||||||||
| Long-Term Cash Bonus(5) | — | 650,008 | 650,008 | 650,008 | 653,230 | 653,230 | ||||||||||||||||
| Executive Group Life Insurance | — | — | 2,770,000 | — | — | — | ||||||||||||||||
| Christopher T. Hjelm | ||||||||||||||||||||||
| Accrued and Banked Vacation | $ | 53,848 | $ | 53,848 | $ | 53,848 | $ | 53,848 | $ | 53,848 | $ | 53,848 | ||||||||||
| Severance | — | — | — | — | — | 2,053,342 | ||||||||||||||||
| Additional Vacation and Bonus | — | — | — | — | — | 39,487 | ||||||||||||||||
| Continued Health and Welfare Benefits(1) | — | — | — | — | — | 48,101 | ||||||||||||||||
| Stock Options(2) | — | — | 2,156,403 | 2,156,403 | 2,156,403 | 2,156,403 | ||||||||||||||||
| Restricted Stock(3) | — | — | 3,730,340 | 3,730,340 | 3,730,340 | 3,730,340 | ||||||||||||||||
| Performance Units(4) | — | 637,879 | 637,879 | 637,879 | 665,727 | 665,727 | ||||||||||||||||
| Long-Term Cash Bonus(5) | — | 606,668 | 606,668 | 606,668 | 610,000 | 610,000 | ||||||||||||||||
| Executive Group Life Insurance | — | — | 3,165,000 | — | — | — | ||||||||||||||||
47
| Name | Involuntary Termination | Voluntary | Death | Disability | Change in Control without Termination | Change in Control with Termination | ||||||||||||||||||||
| Frederick J. Morganthall II | ||||||||||||||||||||||||||
| Accrued and Banked Vacation | $ | 77,310 | $ | 77,310 | $ | 77,310 | $ | 77,310 | $ | 77,310 | $ | 77,310 | ||||||||||||||
| Severance | — | — | — | — | — | 2,180,016 | ||||||||||||||||||||
| Additional Vacation and Bonus | — | — | — | — | — | 41,443 | ||||||||||||||||||||
| Continued Health and Welfare Benefits(1) | — | — | — | — | — | 27,484 | ||||||||||||||||||||
| Stock Options(2) | — | — | 19,180 | 19,180 | 19,180 | 19,180 | ||||||||||||||||||||
| Restricted Stock(3) | — | — | 5,721,797 | 5,721,797 | 5,721,797 | 5,721,797 | ||||||||||||||||||||
| Performance Units(4) | — | 478,038 | 478,038 | 478,038 | 452,195 | 452,195 | ||||||||||||||||||||
| Long-Term Cash Bonus(5) | — | 559,162 | 559,162 | 559,162 | 561,930 | 561,930 | ||||||||||||||||||||
| Executive Group Life Insurance | — | — | 2,295,000 | — | — | — | ||||||||||||||||||||
| (1) | Represents the aggregate present value of continued participation in the Company’s medical, dental and executive term life insurance plans, based on the premiums paid by the Company during the eligible period. The eligible period for continued medical and dental benefits is based on the length of service, which is 22 months for Mr. Hjelm, and 24 months for the other NEOs. The eligible period for continued executive term life insurance coverage is six months for all NEOs. The amounts reported may ultimately be lower if the executive is no longer eligible to receive benefits, which could occur upon obtaining other employment and becoming eligible for substantially equivalent benefits through the new employer. | |
| (2) | Amounts reported in the death, disability and change in control columns represent the intrinsic value of the accelerated vesting of unvested stock options, calculated as the difference between the exercise price of the stock option and the closing price per Kroger common share on January 29, 2016. In accordance with SEC rules, no amount is reported in the voluntary termination/retirement column because vesting is not accelerated, but the awards may continue to vest on the original schedule if the conditions described above are met. | |
| (3) | Amounts reported in the death, disability and change in control columns represent the aggregate value of the accelerated vesting of restricted stock. In accordance with SEC rules, no amount is reported in the voluntary termination/retirement column because vesting is not accelerated, but the awards may continue to vest on the original schedule if the conditions described above are met. | |
| (4) | Amounts reported in the voluntary termination/retirement, death and disability columns represent the aggregate value of the performance units granted in 2014 and 2015, based on the probable outcome of the performance conditions as of January 30, 2016 and prorated for the portion of the performance period completed. Amounts reported in the change in control column represent the aggregate value of 50% of the maximum number of performance units granted in 2014 and 2015 at the beginning of the performance period. Awards under the 2013 Long-Term Incentive Plan were earned as of the last day of 2015 so each NEO was entitled to receive (regardless of the triggering event) the amount actually earned, which is reported in the Stock Awards column of the 2015 Stock Vested Table. | |
| (5) | Amounts reported in the voluntary termination/retirement, death and disability columns represent the aggregate value of the long-term cash bonuses granted in 2014 and 2015, based on the probable outcome of the performance conditions as of January 30, 2016 and prorated for the portion of the performance period completed. Amounts reported in the change in control column represent the aggregate value of 50% of the long-term cash bonus potentials under the 2014 and 2015 Long-Term Incentive Plans. Awards under the 2013 Long-Term Incentive Plan were earned as of the last day of 2015, so each NEO was entitled to receive (regardless of the triggering event) the amount actually earned, which is reported in the Non-Equity Incentive Plan Compensation column of the Summary Compensation Table. | |
48
Item 2. Advisory Vote on Executive Compensation
You are being asked to vote, on an advisory basis, to approve the compensation of our NEOs. The Board of Directors recommends that you vote FOR the approval of compensation of our NEOs.
The Dodd-Frank Wall Street Reform and Consumer Protection Act, enacted in July 2010, requires that we give our shareholders the right to approve, on a nonbinding, advisory basis, the compensation of our NEOs as disclosed earlier in this proxy statement in accordance with the SEC’s rules.
As discussed earlier in the Compensation Discussion and Analysis, our compensation philosophy is to attract and retain the best management talent and to motivate these employees to achieve our business and financial goals. Our incentive plans are designed to reward the actions that lead to long-term value creation. To achieve our objectives, we seek to ensure that compensation is competitive and that there is a direct link between pay and performance. To do so, we are guided by the following principles:
| ● | A significant portion of pay should be performance-based, with the percentage of total pay tied to performance increasing proportionally with an executive’s level of responsibility; |
| ● | Compensation should include incentive-based pay to drive performance, providing superior pay for superior performance, including both a short- and long-term focus; |
| ● | Compensation policies should include an opportunity for, and a requirement of, equity ownership to align the interests of executives and shareholders; and |
| ● | Components of compensation should be tied to an evaluation of business and individual performance measured against metrics that directly drive our business strategy. |
The vote on this resolution is not intended to address any specific element of compensation. Rather, the vote relates to the compensation of our NEOs as described in this proxy statement. The vote is advisory. This means that the vote is not binding on Kroger. The Compensation Committee of the Board is responsible for financial reporting purposes.establishing executive compensation. In so doing that Compensation Committee will consider, along with all other relevant factors, the results of this vote.
We ask our shareholders to vote on the following resolution:
“RESOLVED, that the compensation paid to the Company’s NEOs, as disclosed pursuant to Item 402 of Regulation S-K, including the Compensation Discussion and Analysis, compensation tables, and the related narrative discussion, is hereby APPROVED.”
The next advisory vote will occur at our 2017 annual meeting.
The Board of Directors Recommends a VoteFor This Proposal.
49
Director Compensation
2015 Director Compensation
The following table describes the 2015 compensation for non-employee directors. Mr. McMullen does not receive compensation for his Board service.
| Name | Fees Earned or Paid in Cash | Stock Awards(1) | Option Awards(1) | Change in Pension Value and Nonqualified Deferred Compensation Earnings(2) | Total | |||||||||||||||
| Nora A. Aufreiter | $ | 84,772 | $ | 165,586 | — | — | $ | 250,358 | ||||||||||||
| Robert D. Beyer | $ | 124,664 | $ | 165,586 | — | $ | 8,271 | $ | 298,521 | |||||||||||
| Anne Gates(3) | $ | 13,280 | $ | 98,136 | — | — | $ | 111,416 | ||||||||||||
| Susan J. Kropf | $ | 94,745 | $ | 165,586 | — | — | $ | 260,331 | ||||||||||||
| David B. Lewis | $ | 84,772 | $ | 165,586 | — | — | $ | 250,358 | ||||||||||||
| Jorge P. Montoya | $ | 99,731 | $ | 165,586 | — | — | $ | 265,317 | ||||||||||||
| Clyde R. Moore | $ | 104,718 | $ | 165,586 | — | $ | 11,753 | $ | 282,057 | |||||||||||
| Susan M. Phillips | $ | 94,745 | $ | 165,586 | — | $ | 2,701 | $ | 263,032 | |||||||||||
| James A. Runde | $ | 99,731 | $ | 165,586 | — | — | $ | 265,317 | ||||||||||||
| Ronald L. Sargent | $ | 114,691 | $ | 165,586 | — | $ | 2,777 | $ | 283,054 | |||||||||||
| Bobby S. Shackouls | $ | 94,745 | $ | 165,586 | — | — | $ | 260,331 | ||||||||||||
| (1) | Amounts reported in the Stock Awards column represent the aggregate grant date fair value of the annual incentive share award, computed in accordance with FASB ASC Topic 718. Options are no longer granted to non-employee directors. The aggregate number of previously granted stock options that remained unexercised and outstanding at fiscal year-end was as follows: |
| Name | Options | |
| Ms. Aufreiter | — | |
| Mr. Beyer | 85,000 | |
| Ms. Gates | — | |
| Ms. Kropf | 75,000 | |
| Mr. Lewis | 75,000 | |
| Mr. Montoya | 75,000 | |
| Mr. Moore | 65,000 | |
| Ms. Phillips | 85,000 | |
| Mr. Runde | 85,000 | |
| Mr. Sargent | 85,000 | |
| Mr. Shackouls | 7,800 |
| (2) | The amounts reported for Messrs. Beyer and Sargent and Dr. Phillips represent preferential earnings on nonqualified deferred compensation. For a complete explanation of preferential earnings, please refer to footnote 5 to the Summary Compensation Table. The amount reported for Mr. Moore represents the change in actuarial present value of his accumulated benefit under the pension plan for non-employee directors. | |
| (3) | Ms. Gates joined the Board in December 2015. Her retainer and incentive shares were prorated accordingly. | |
50
Annual Compensation
Each non-employee director receives an annual cash retainer of $85,000. The chairs of each of the Audit Committee and the Compensation Committee receive an additional annual cash retainer of $20,000. The chair of each of the other committees receives an additional annual cash retainer of $15,000. Each member of the Audit Committee receives an additional annual cash retainer of $10,000. The director designated as the Lead Director receives an additional annual cash retainer of $25,000.
Approximately $165,000 worth of incentive shares (Kroger common shares) are issued to non-employee directors as a portion of the directors’ overall compensation. On July 15, 2015, each non-employee director, except for Ms. Gates, received 4,320 common shares. Ms. Gates received 2,386 common shares on December 10, 2015 upon joining the Board.
The Board has determined that compensation of non-employee directors must be competitive on an ongoing basis to attract and retain directors who meet the qualifications for service on the Board. Non-employee director compensation will be reviewed from time to time as the Corporate Governance Committee deems appropriate.
Pension Plan
Non-employee directors first elected prior to July 17, 1997 receive an unfunded retirement benefit equal to the average cash compensation for the five calendar years preceding retirement. Only Mr. Moore is eligible for this benefit. Participants who retire from the Board prior to age 70 will be credited with 50% vesting after five years of service, and 10% for each additional year up to a maximum of 100%. Benefits for participants who retire prior to age 70 begin at the later of actual retirement or age 65.
Potential Payments upon Termination or Change in Control
Kroger does not have employment agreements or other contracts, agreements, plans or arrangements that provide for payments to the NEOs in connection with a termination of employment or a change in control of Kroger. However, KEPP, our award agreements for stock options, restricted stock and performance units and our long-term cash bonus plans provide for certain payments and benefits to participants, including the NEOs, in the event of a termination of employment or a change in control of Kroger, as described below. Our pension plans and nonqualified deferred compensation plan also provide for certain payments and benefits to participants in the event of a termination of employment, as described above in the Pension Benefits section and the Nonqualified Deferred Compensation section, respectively.
A “change in control” under KEPP, and our equity and non-equity incentive awards occurs if:
| ● | any person or entity (excluding Kroger’s employee benefit plans) acquires 20% or more of the voting power of Kroger; |
| ● | a merger, consolidation, share exchange, division, or other reorganization or transaction with Kroger results in Kroger’s voting securities existing prior to that event representing less than 60% of the combined voting power immediately after the event; |
| ● | Kroger’s shareholders approve a plan of complete liquidation or winding up of Kroger or an agreement for the sale or disposition of all or substantially all of Kroger’s assets; or |
| ● | during any period of 24 consecutive months, individuals at the beginning of the period who constituted Kroger’s Board of Directors cease for any reason to constitute at least a majority of the Board of Directors. |
KEPP
KEPP applies to all management employees and administrative support personnel who are not covered by a collective bargaining agreement, with at least one year of service, and provides severance benefits when a participant’s employment is terminated actually or constructively within two years following a change in control of Kroger, including the NEOs. The actual amount is dependent on pay level and years of service. The NEOs are eligible for the following benefits:
| ● | a lump sum severance payment equal to up to two times the sum of the participant’s annual base salary and 70% of the greater of the current annual cash bonus potential or the average of the actual annual cash bonus payments for the prior three years; |
45
| ● | a lump sum payment equal to the participant’s accrued and unpaid vacation, including banked vacation; |
| ● | a lump sum payment equal to 1/12th of the sum of the participant’s annual vacation pay plus 70% of the greater of the current year’s annual cash bonus potential or the average of the actual annual cash bonus payments for the prior three years, multiplied by the number of months elapsed in the current calendar year; |
| ● | continued medical and dental benefits for up to 24 months and continued life insurance coverage for up to 6 months; and |
| ● | up to $5,000 as reimbursement for eligible tuition expenses and up to $10,000 as reimbursement for eligible outplacement expenses. |
Payments to executive officers under KEPP will be reduced, to the extent necessary, so that payments will not exceed 2.99 times the officer’s average W-2 earnings over the preceding five years.
Long-Term Compensation Awards
The following table describes the treatment of long-term compensation awards following a termination of employment or change in control of Kroger. In each case, the continued vesting, exercisability or eligibility for the incentive awards will end if the participant provides services to a competitor of Kroger.
| Triggering Event | Stock Options | Restricted Stock | Performance Units | Performance-Based Long-Term Cash Bonus | |||
Involuntary | Forfeit all unvested options. Previously vested options remain exercisable for the shorter of one year after termination or the remainder of the original 10-year term. | Forfeit all unvested shares | Forfeit all rights to units for which the three year performance period has not ended | Forfeit all rights to long-term cash bonuses for which the three year performance period has not ended | |||
Voluntary - Prior to minimum | Forfeit all unvested options. Previously vested options remain exercisable for the shorter of one year after termination or the remainder of the original 10-year term. | Forfeit all unvested shares | Forfeit all rights to units for which the three year performance period has not ended | Forfeit all rights to long-term cash bonuses for which the three year performance period has not ended | |||
Voluntary - After minimum age | Unvested options continue vesting on the original schedule. All options are exercisable for remainder of the original 10-year term. | Forfeit all unvested shares granted prior to 2013. Vesting continues on the original schedule for awards granted during or after 2013. | Pro rata portion(1) of units earned based on performance results over the full three-year period | Pro rata portion(1) of long-term cash bonuses earned based on performance results over the full three-year period | |||
Death | Unvested options are immediately vested. All options are exercisable for remainder of the original 10-year term. | Unvested shares immediately vest | Pro rata portion(1) of units earned based on performance results through the end of the fiscal year in which death occurs. Award will be paid following the end of such fiscal year. | Pro rata portion(1) of long-term cash bonuses earned based on performance results through the end of the fiscal year in which death occurs. Award will be paid following the end of such fiscal year. | |||
Disability | Unvested options are immediately vested. All options are exercisable for remainder of the original 10-year term. | Unvested shares immediately vest | Pro rata portion(1) of units earned based on performance results over the full three-year period | Pro rata portion(1) of long-term cash bonuses earned based on performance results over the full three-year period | |||
Change in | Unvested options are immediately vested and exercisable | Unvested shares immediately vest | 50% of the maximum units granted at the beginning of the performance period earned immediately | 50% of the maximum bonus granted at the beginning of the performance period earned immediately |
46
| (1) | The prorated amount is equal to the number of weeks of active employment during the performance period divided by the total number of weeks in the performance period. | |
| (2) | The minimum age requirement is age 62 for stock options and restricted stock and age 55 for performance units and the long-term cash bonus. | |
| (3) | These benefits are payable upon a change in control of Kroger with or without a termination of employment. | |
Quantification of Payments upon Termination or Change in Control
The following table provides information regarding certain potential payments that would have been made to the NEOs if the triggering event occurred on nonqualified deferredthe last day of the fiscal year, January 30, 2016, given compensation, forage and service levels as of that date and, where applicable, based on the named executive officers for 2013.closing market price per Kroger common share on the last trading day of the fiscal year ($38.81 on January 29, 2016). Amounts actually received upon the occurrence of a triggering event will vary based on factors such as the timing during the year of such event, the market price of Kroger common shares, and the officer’s age, length of service and compensation levels.
| Name | Involuntary Termination | Voluntary Termination/ Retirement | Death | Disability | Change in Control without Termination | Change in | ||||||||||||||||
| W. Rodney McMullen | ||||||||||||||||||||||
| Accrued and Banked Vacation | $ | 763,072 | $ | 763,072 | $ | 763,072 | $ | 763,072 | $ | 763,072 | $ | 763,072 | ||||||||||
| Severance | — | — | — | — | — | 4,790,016 | ||||||||||||||||
| Additional Vacation and Bonus | — | — | — | — | — | 108,173 | ||||||||||||||||
| Continued Health and Welfare Benefits(1) | — | — | — | — | — | 58,326 | ||||||||||||||||
| Stock Options(2) | — | — | 8,973,448 | 8,973,448 | 8,973,448 | 8,973,448 | ||||||||||||||||
| Restricted Stock(3) | — | — | 13,928,560 | 13,928,560 | 13,928,560 | 13,928,560 | ||||||||||||||||
| Performance Units(4) | — | 2,615,463 | 2,615,463 | 2,615,463 | 2,467,908 | 2,467,908 | ||||||||||||||||
| Long-Term Cash Bonus(5) | — | 1,133,340 | 1,133,340 | 1,133,340 | 1,150,000 | 1,150,000 | ||||||||||||||||
| Executive Group Life Insurance | — | — | 4,910,000 | — | — | — | ||||||||||||||||
| J. Michael Schlotman | ||||||||||||||||||||||
| Accrued and Banked Vacation | $ | 516,928 | $ | 516,928 | $ | 516,928 | $ | 516,928 | $ | 516,928 | $ | 516,928 | ||||||||||
| Severance | — | — | — | — | — | 2,581,080 | ||||||||||||||||
| Additional Vacation and Bonus | — | — | — | — | — | 45,622 | ||||||||||||||||
| Continued Health and Welfare Benefits(1) | — | — | — | — | — | 48,995 | ||||||||||||||||
| Stock Options(2) | — | — | 3,962,059 | 3,962,059 | 3,962,059 | 3,962,059 | ||||||||||||||||
| Restricted Stock(3) | — | — | 5,929,004 | 5,929,004 | 5,929,004 | 5,929,004 | ||||||||||||||||
| Performance Units(4) | — | 850,471 | 850,471 | 850,471 | 887,585 | 887,585 | ||||||||||||||||
| Long-Term Cash Bonus(5) | — | 743,335 | 743,335 | 743,335 | 747,500 | 747,500 | ||||||||||||||||
| Executive Group Life Insurance | — | — | 3,064,200 | — | — | — | ||||||||||||||||
| Michael J. Donnelly | ||||||||||||||||||||||
| Accrued and Banked Vacation | $ | 245,191 | $ | 245,191 | $ | 245,191 | $ | 245,191 | $ | 245,191 | $ | 245,191 | ||||||||||
| Severance | — | — | — | — | — | 2,345,731 | ||||||||||||||||
| Additional Vacation and Bonus | — | — | — | — | — | 42,451 | ||||||||||||||||
| Continued Health and Welfare Benefits(1) | — | — | — | — | — | 38,794 | ||||||||||||||||
| Stock Options(2) | — | — | 2,252,578 | 2,252,578 | 2,252,578 | 2,252,578 | ||||||||||||||||
| Restricted Stock(3) | — | — | 3,908,361 | 3,908,361 | 3,908,361 | 3,908,361 | ||||||||||||||||
| Performance Units(4) | — | 575,422 | 575,422 | 575,422 | 572,059 | 572,059 | ||||||||||||||||
| Long-Term Cash Bonus(5) | — | 650,008 | 650,008 | 650,008 | 653,230 | 653,230 | ||||||||||||||||
| Executive Group Life Insurance | — | — | 2,770,000 | — | — | — | ||||||||||||||||
| Christopher T. Hjelm | ||||||||||||||||||||||
| Accrued and Banked Vacation | $ | 53,848 | $ | 53,848 | $ | 53,848 | $ | 53,848 | $ | 53,848 | $ | 53,848 | ||||||||||
| Severance | — | — | — | — | — | 2,053,342 | ||||||||||||||||
| Additional Vacation and Bonus | — | — | — | — | — | 39,487 | ||||||||||||||||
| Continued Health and Welfare Benefits(1) | — | — | — | — | — | 48,101 | ||||||||||||||||
| Stock Options(2) | — | — | 2,156,403 | 2,156,403 | 2,156,403 | 2,156,403 | ||||||||||||||||
| Restricted Stock(3) | — | — | 3,730,340 | 3,730,340 | 3,730,340 | 3,730,340 | ||||||||||||||||
| Performance Units(4) | — | 637,879 | 637,879 | 637,879 | 665,727 | 665,727 | ||||||||||||||||
| Long-Term Cash Bonus(5) | — | 606,668 | 606,668 | 606,668 | 610,000 | 610,000 | ||||||||||||||||
| Executive Group Life Insurance | — | — | 3,165,000 | — | — | — | ||||||||||||||||
47
2013 NONQUALIFIED DEFERRED COMPENSATION | ||||||||||||||
Name | Executive Contributions in Last FY ($) | Registrant Contributions in Last FY ($) | Aggregate Earnings in Last FY ($) | Aggregate Withdrawals/ Distributions ($) | Aggregate Balance at Last FYE ($) | |||||||||
| David B. Dillon | $ | 60,000 | (1) | $0 | $ | 76,367 | $0 | $ | 1,173,732 | |||||
| W. Rodney McMullen | $ | 215,817 | (2) | $0 | $ | 452,389 | $0 | $ | 6,998,182 | |||||
| J. Michael Schlotman | $ | 0 | $0 | $ | 0 | $0 | $ | 0 | ||||||
| Paul W. Heldman | $ | 0 | $0 | $ | 80,713 | $0 | $ | 1,449,413 | ||||||
| Kathleen S. Barclay | $ | 0 | $0 | $ | 0 | $0 | $ | 0 | ||||||
| Michael L. Ellis | $ | 0 | $0 | $ | 33,804 | $0 | $ | 584,760 | ||||||
| Name | Involuntary Termination | Voluntary | Death | Disability | Change in Control without Termination | Change in Control with Termination | ||||||||||||||||||||
| Frederick J. Morganthall II | ||||||||||||||||||||||||||
| Accrued and Banked Vacation | $ | 77,310 | $ | 77,310 | $ | 77,310 | $ | 77,310 | $ | 77,310 | $ | 77,310 | ||||||||||||||
| Severance | — | — | — | — | — | 2,180,016 | ||||||||||||||||||||
| Additional Vacation and Bonus | — | — | — | — | — | 41,443 | ||||||||||||||||||||
| Continued Health and Welfare Benefits(1) | — | — | — | — | — | 27,484 | ||||||||||||||||||||
| Stock Options(2) | — | — | 19,180 | 19,180 | 19,180 | 19,180 | ||||||||||||||||||||
| Restricted Stock(3) | — | — | 5,721,797 | 5,721,797 | 5,721,797 | 5,721,797 | ||||||||||||||||||||
| Performance Units(4) | — | 478,038 | 478,038 | 478,038 | 452,195 | 452,195 | ||||||||||||||||||||
| Long-Term Cash Bonus(5) | — | 559,162 | 559,162 | 559,162 | 561,930 | 561,930 | ||||||||||||||||||||
| Executive Group Life Insurance | — | — | 2,295,000 | — | — | — | ||||||||||||||||||||
| (1) | ||||
| (2) | ||||
| (3) | Amounts reported in the death, disability and change in control columns represent the aggregate value of | |||
| (4) | Amounts reported in the voluntary termination/retirement, death and | |||
| (5) | Amounts reported in the voluntary termination/retirement, death and disability columns represent the aggregate value of the long-term cash bonuses granted in 2014 and 2015, based on the probable outcome of the performance conditions as of January 30, 2016 and prorated for the portion of the performance period completed. Amounts reported in the change in control column represent the aggregate value of 50% of the long-term cash bonus potentials under the 2014 and 2015 Long-Term Incentive Plans. Awards under the 2013 Long-Term Incentive Plan were earned | |||
Eligible participants may elect to defer up to 100% of the amount of their salary that exceeds the sum of the FICA wage base and pre-tax insurance and other Internal Revenue Code Section 125 plan deductions, as well as 100% of their annual and long-term bonus compensation. Deferral account amounts are credited with
4148
interest atItem 2. Advisory Vote on Executive Compensation
You are being asked to vote, on an advisory basis, to approve the rate representing Kroger’s costcompensation of ten-year debtour NEOs. The Board of Directors recommends that you vote FOR the approval of compensation of our NEOs.
The Dodd-Frank Wall Street Reform and Consumer Protection Act, enacted in July 2010, requires that we give our shareholders the right to approve, on a nonbinding, advisory basis, the compensation of our NEOs as determined by Kroger’s CEOdisclosed earlier in this proxy statement in accordance with the SEC’s rules.
As discussed earlier in the Compensation Discussion and reviewedAnalysis, our compensation philosophy is to attract and retain the best management talent and to motivate these employees to achieve our business and financial goals. Our incentive plans are designed to reward the actions that lead to long-term value creation. To achieve our objectives, we seek to ensure that compensation is competitive and that there is a direct link between pay and performance. To do so, we are guided by the following principles:
| ● | A significant portion of pay should be performance-based, with the percentage of total pay tied to performance increasing proportionally with an executive’s level of responsibility; |
| ● | Compensation should include incentive-based pay to drive performance, providing superior pay for superior performance, including both a short- and long-term focus; |
| ● | Compensation policies should include an opportunity for, and a requirement of, equity ownership to align the interests of executives and shareholders; and |
| ● | Components of compensation should be tied to an evaluation of business and individual performance measured against metrics that directly drive our business strategy. |
The vote on this resolution is not intended to address any specific element of compensation. Rather, the vote relates to the compensation of our NEOs as described in this proxy statement. The vote is advisory. This means that the vote is not binding on Kroger. The Compensation Committee priorof the Board is responsible for establishing executive compensation. In so doing that Compensation Committee will consider, along with all other relevant factors, the results of this vote.
We ask our shareholders to vote on the following resolution:
“RESOLVED, that the compensation paid to the beginningCompany’s NEOs, as disclosed pursuant to Item 402 of each deferral year. Regulation S-K, including the Compensation Discussion and Analysis, compensation tables, and the related narrative discussion, is hereby APPROVED.”
The interest rate established for deferral amounts for each deferral yearnext advisory vote will be applied to those deferral amounts for all subsequent years until the deferred compensation is paid out. Participants can elect to receive lump sum distributions or quarterly installments for periods up to ten years. Participants also can elect between lump sum distributions and quarterly installments to be received by designated beneficiaries if the participant dies before distributionoccur at our 2017 annual meeting.
The Board of deferred compensation is completed.Directors Recommends a VoteFor This Proposal.
49
Director Compensation
2015 Director Compensation
The following table describes the fiscal year 20132015 compensation for non-employee directors. Employee directorsMr. McMullen does not receive no compensation for theirhis Board service.
2013 DIRECTOR COMPENSATION | ||||||||||||||||||||||||
Name | Fees Earned or Paid in Cash ($) | Stock Awards ($) | Option Awards ($) | Non-Equity Incentive Plan Compensation ($) | Change in Pension Value and Nonqualified Deferred Compensation Earnings ($) | All Other Compensation ($) | Total ($) | |||||||||||||||||
| (2) | (2) | (12) | ||||||||||||||||||||||
| Reuben V. Anderson | $ | 79,823 | $ | 165,011 | $—(4) | — | $ | 833 | (10) | $ | 189 | $ | 245,856 | |||||||||||
| Robert D. Beyer | $ | 99,935 | $ | 165,011 | (3) | $—(4) | — | $ | 6,664 | (11) | $ | 189 | $ | 271,799 | ||||||||||
| Susan J. Kropf | $ | 89,798 | $ | 165,011 | (3) | $—(5) | — | N/A | $ | 189 | $ | 254,998 | ||||||||||||
| John T. LaMacchia (1) | $ | 72,512 | $ | 67,817 | $—(7) | — | $ | 455 | (11) | $ | 3,556 | (13) | $ | 144,340 | ||||||||||
| David B. Lewis | $ | 79,823 | $ | 165,011 | $—(6) | — | N/A | $ | 189 | $ | 245,023 | |||||||||||||
| Jorge P. Montoya | $ | 93,299 | $ | 165,011 | $—(5) | — | N/A | $ | 189 | $ | 258,499 | |||||||||||||
| Clyde R. Moore | $ | 95,815 | $ | 165,011 | (3) | $—(7) | — | $ | 2,900 | (10) | $ | 189 | $ | 263,915 | ||||||||||
| Susan M. Phillips | $ | 89,798 | $ | 165,011 | $—(8) | — | $ | 2,211 | (11) | $ | 189 | $ | 257,209 | |||||||||||
| Steven R. Rogel | $ | 79,823 | $ | 165,011 | $—(4) | — | N/A | $ | 189 | $ | 245,023 | |||||||||||||
| James A. Runde | $ | 93,299 | $ | 165,011 | $—(6) | — | N/A | $ | 189 | $ | 258,499 | |||||||||||||
| Ronald L. Sargent | $ | 105,784 | $ | 165,011 | (3) | $—(6) | — | $ | 2,279 | (11) | $ | 189 | $ | 273,263 | ||||||||||
| Bobby S. Shackouls | $ | 105,628 | $ | 165,011 | (3) | $—(9) | — | N/A | $ | 189 | $ | 270,828 | ||||||||||||
| Name | Fees Earned or Paid in Cash | Stock Awards(1) | Option Awards(1) | Change in Pension Value and Nonqualified Deferred Compensation Earnings(2) | Total | |||||||||||||||
| Nora A. Aufreiter | $ | 84,772 | $ | 165,586 | — | — | $ | 250,358 | ||||||||||||
| Robert D. Beyer | $ | 124,664 | $ | 165,586 | — | $ | 8,271 | $ | 298,521 | |||||||||||
| Anne Gates(3) | $ | 13,280 | $ | 98,136 | — | — | $ | 111,416 | ||||||||||||
| Susan J. Kropf | $ | 94,745 | $ | 165,586 | — | — | $ | 260,331 | ||||||||||||
| David B. Lewis | $ | 84,772 | $ | 165,586 | — | — | $ | 250,358 | ||||||||||||
| Jorge P. Montoya | $ | 99,731 | $ | 165,586 | — | — | $ | 265,317 | ||||||||||||
| Clyde R. Moore | $ | 104,718 | $ | 165,586 | — | $ | 11,753 | $ | 282,057 | |||||||||||
| Susan M. Phillips | $ | 94,745 | $ | 165,586 | — | $ | 2,701 | $ | 263,032 | |||||||||||
| James A. Runde | $ | 99,731 | $ | 165,586 | — | — | $ | 265,317 | ||||||||||||
| Ronald L. Sargent | $ | 114,691 | $ | 165,586 | — | $ | 2,777 | $ | 283,054 | |||||||||||
| Bobby S. Shackouls | $ | 94,745 | $ | 165,586 | — | — | $ | 260,331 | ||||||||||||
| (1) | ||
| Name | Options | |
| Ms. Aufreiter | — | |
| Ms. Gates | — | |
| Mr. Lewis | 75,000 | |
| Mr. Moore | 65,000 | |
| Mr. Runde | 85,000 | |
| (2) | ||
| (3) | Ms. Gates joined the Board in December 2015. Her retainer and incentive shares were prorated accordingly. | |
4250
Effective August 1, 2013, eachAnnual Compensation
Each non-employee director receives an annual cash retainer of $85,000. The chairs of each of the Audit Committee and the Compensation Committee receive an additional annual cash retainer of $20,000. The chair of each of the other committees receives an additional annual cash retainer of $15,000. Each member of the Audit Committee receives an additional annual cash retainer of $10,000. The director designated as the Lead Director receives an additional annual cash retainer of $25,000. Beginning in 2013,
Approximately $165,000 worth of incentive shares were(Kroger common shares) are issued to non-employee directors in lieu of options and restricted stock, as a portion of the directors’ overall compensation. On July 15, 2013,2015, each non-employee director, except for Mr. LaMacchia,Ms. Gates, received 4,3704,320 common shares. Mr. LaMacchiaMs. Gates received 1,7962,386 common shares on December 10, 2015 upon joining the Board.
The Board has determined that compensation of non-employee directors must be competitive on an ongoing basis to attract and retain directors who meet the qualifications for service on the Board. Non-employee director compensation will be reviewed from time to time as his award was prorated as a result of his planned retirement.the Corporate Governance Committee deems appropriate.
Pension Plan
Non-employee directors first elected prior to July 17, 1997 receive a major medical plan benefit as well as an unfunded retirement benefit. The retirement benefit equalsequal to the average cash compensation for the five calendar years preceding retirement. Only Mr. Moore is eligible for this benefit. Participants who retire from the Board prior to age 70 will be credited with 50% vesting after five years of service, and 10% for each additional year up to a maximum of 100%. Benefits for participants who retire prior to age 70 begin at the later of actual retirement or age 65.
We also maintain a deferred compensation plan, in which all non-employee members of the Board are eligible to participate. Participants may defer up to 100% of their cash compensation. They may elect from either or both of the following two alternative methods of determining benefits:
In both cases, deferred amounts are paid out only in cash, based on deferral options selected by the participants at the time the deferral elections are made. Participants can elect to have distributions made in a lump sum or in quarterly installments, and may make comparable elections for designated beneficiaries who receive benefits in the event that deferred compensation is not completely paid out upon the death of the participant.
The Board has determined that compensation of non-employee directors must be competitive on an on-going basis to attract and retain directors who meet the qualifications for service on Kroger’s Board. Non-employee director compensation will be reviewed from time to time as the Corporate Governance Committee deems appropriate.
Potential Payments upon Termination or Change in Control
Kroger has nodoes not have employment agreements with its named executive officers and noor other contracts, agreements, plans or arrangements that provide for payments to the named executive officersNEOs in connection with resignation, severance, retirement,a termination of employment or a change in control exceptof Kroger. However, KEPP, our award agreements for those available generallystock options, restricted stock and performance units and our long-term cash bonus plans provide for certain payments and benefits to salaried employees. Theparticipants, including the NEOs, in the event of a termination of employment or a change in control of Kroger, Co. Employee Protection Plan,as described below. Our pension plans and nonqualified deferred compensation plan also provide for certain payments and benefits to participants in the event of a termination of employment, as described above in the Pension Benefits section and the Nonqualified Deferred Compensation section, respectively.
A “change in control” under KEPP, and our equity and non-equity incentive awards occurs if:
| ● | any person or entity (excluding Kroger’s employee benefit plans) acquires 20% or more of the voting power of Kroger; |
| ● | a merger, consolidation, share exchange, division, or other reorganization or transaction with Kroger results in Kroger’s voting securities existing prior to that event representing less than 60% of the combined voting power immediately after the event; |
| ● | Kroger’s shareholders approve a plan of complete liquidation or winding up of Kroger or an agreement for the sale or disposition of all or substantially all of Kroger’s assets; or |
| ● | during any period of 24 consecutive months, individuals at the beginning of the period who constituted Kroger’s Board of Directors cease for any reason to constitute at least a majority of the Board of Directors. |
KEPP
KEPP applies to all management employees and administrative support personnel who are not covered by a collective bargaining agreement, with at least one year of service, and provides severance benefits when a participant’s employment is terminated actually or constructively within two years following a change in control of Kroger.Kroger, including the NEOs. The actual amount is dependent on pay level and years of service. For purposes of KEPP, a change in control occurs if:
| ● | a lump sum severance payment equal to up to two times the sum of the participant’s annual base salary and 70% of the greater of the current annual cash bonus potential or the average of the actual annual cash bonus payments for the prior three years; |
4345
| ● | a lump sum payment equal to the participant’s accrued and unpaid vacation, including banked vacation; |
| ● | a lump sum payment equal to 1/12th of the sum of the participant’s annual vacation pay plus 70% of the greater of the current year’s annual cash bonus potential or the average of the actual annual cash bonus payments for the prior three years, multiplied by the number of months elapsed in the current calendar year; |
| ● | continued medical and dental benefits for up to 24 months and continued life insurance coverage for up to 6 months; and |
| ● | up to $5,000 as reimbursement for eligible tuition expenses and up to $10,000 as reimbursement for eligible outplacement expenses. |
Payments to constitute at least a majority of the Board of Directors.
Assuming that a change in control occurred on the last day of Kroger’s fiscal year 2013, and the named executive officers had their employment terminated, they would receive a maximum payment, or, in the case of group term life insurance, a benefit having a cost to Kroger, in the amounts shown below:
| Accrued | |||||||||||||||
| Additional | and | Group | |||||||||||||
| Severance | Vacation and | Banked | Term Life | Tuition | Outplacement | ||||||||||
| Name | Benefit | Bonus | Vacation | Insurance | Reimbursement | Reimbursement | |||||||||
| David B. Dillon | $4,958,446 | $ | 107,366 | $ | 776,640 | $32 | $5,000 | $10,000 | |||||||
| W. Rodney McMullen | $3,458,466 | $ | 73,132 | $ | 592,448 | $32 | $5,000 | $10,000 | |||||||
| J. Michael Schlotman | $2,187,021 | $ | 40,364 | $ | 423,744 | $32 | $5,000 | $10,000 | |||||||
| Kathleen S. Barclay | $2,204,318 | $ | 41,224 | $ | 66,030 | $32 | $5,000 | $10,000 | |||||||
| Paul W. Heldman | $2,375,510 | $ | 42,047 | $ | 222,780 | $32 | $5,000 | $10,000 | |||||||
| Michael L. Ellis | $1,654,634 | $ | 29,166 | $ | 93,384 | $32 | $5,000 | $10,000 | |||||||
Each of the named executive officers also is entitled to continuation of health care coverage for up to 24 months at the same contribution rate as existed prior to the change in control. The cost to Kroger cannot be calculated, as Kroger self insures the health care benefit and the cost is based on the health care services utilized by the participant and eligible dependents.
Under theunder KEPP benefits will be reduced, to the extent necessary, so that payments to an executive officer will in no eventnot exceed 2.99 times the officer’s average W-2 earnings over the preceding five years.
Kroger’sLong-Term Compensation Awards
The following table describes the treatment of long-term compensation awards following a termination of employment or change in control benefits under KEPPof Kroger. In each case, the continued vesting, exercisability or eligibility for the incentive awards will end if the participant provides services to a competitor of Kroger.
| Triggering Event | Stock Options | Restricted Stock | Performance Units | Performance-Based Long-Term Cash Bonus | |||
Involuntary | Forfeit all unvested options. Previously vested options remain exercisable for the shorter of one year after termination or the remainder of the original 10-year term. | Forfeit all unvested shares | Forfeit all rights to units for which the three year performance period has not ended | Forfeit all rights to long-term cash bonuses for which the three year performance period has not ended | |||
Voluntary - Prior to minimum | Forfeit all unvested options. Previously vested options remain exercisable for the shorter of one year after termination or the remainder of the original 10-year term. | Forfeit all unvested shares | Forfeit all rights to units for which the three year performance period has not ended | Forfeit all rights to long-term cash bonuses for which the three year performance period has not ended | |||
Voluntary - After minimum age | Unvested options continue vesting on the original schedule. All options are exercisable for remainder of the original 10-year term. | Forfeit all unvested shares granted prior to 2013. Vesting continues on the original schedule for awards granted during or after 2013. | Pro rata portion(1) of units earned based on performance results over the full three-year period | Pro rata portion(1) of long-term cash bonuses earned based on performance results over the full three-year period | |||
Death | Unvested options are immediately vested. All options are exercisable for remainder of the original 10-year term. | Unvested shares immediately vest | Pro rata portion(1) of units earned based on performance results through the end of the fiscal year in which death occurs. Award will be paid following the end of such fiscal year. | Pro rata portion(1) of long-term cash bonuses earned based on performance results through the end of the fiscal year in which death occurs. Award will be paid following the end of such fiscal year. | |||
Disability | Unvested options are immediately vested. All options are exercisable for remainder of the original 10-year term. | Unvested shares immediately vest | Pro rata portion(1) of units earned based on performance results over the full three-year period | Pro rata portion(1) of long-term cash bonuses earned based on performance results over the full three-year period | |||
Change in | Unvested options are immediately vested and exercisable | Unvested shares immediately vest | 50% of the maximum units granted at the beginning of the performance period earned immediately | 50% of the maximum bonus granted at the beginning of the performance period earned immediately |
46
| (1) | The prorated amount is equal to the number of weeks of active employment during the performance period divided by the total number of weeks in the performance period. | |
| (2) | The minimum age requirement is age 62 for stock options and restricted stock and age 55 for performance units and the long-term cash bonus. | |
| (3) | These benefits are payable upon a change in control of Kroger with or without a termination of employment. | |
Quantification of Payments upon Termination or Change in Control
The following table provides information regarding certain potential payments that would have been made to the NEOs if the triggering event occurred on the last day of the fiscal year, January 30, 2016, given compensation, age and under equityservice levels as of that date and, where applicable, based on the closing market price per Kroger common share on the last trading day of the fiscal year ($38.81 on January 29, 2016). Amounts actually received upon the occurrence of a triggering event will vary based on factors such as the timing during the year of such event, the market price of Kroger common shares, and the officer’s age, length of service and compensation levels.
| Name | Involuntary Termination | Voluntary Termination/ Retirement | Death | Disability | Change in Control without Termination | Change in | ||||||||||||||||
| W. Rodney McMullen | ||||||||||||||||||||||
| Accrued and Banked Vacation | $ | 763,072 | $ | 763,072 | $ | 763,072 | $ | 763,072 | $ | 763,072 | $ | 763,072 | ||||||||||
| Severance | — | — | — | — | — | 4,790,016 | ||||||||||||||||
| Additional Vacation and Bonus | — | — | — | — | — | 108,173 | ||||||||||||||||
| Continued Health and Welfare Benefits(1) | — | — | — | — | — | 58,326 | ||||||||||||||||
| Stock Options(2) | — | — | 8,973,448 | 8,973,448 | 8,973,448 | 8,973,448 | ||||||||||||||||
| Restricted Stock(3) | — | — | 13,928,560 | 13,928,560 | 13,928,560 | 13,928,560 | ||||||||||||||||
| Performance Units(4) | — | 2,615,463 | 2,615,463 | 2,615,463 | 2,467,908 | 2,467,908 | ||||||||||||||||
| Long-Term Cash Bonus(5) | — | 1,133,340 | 1,133,340 | 1,133,340 | 1,150,000 | 1,150,000 | ||||||||||||||||
| Executive Group Life Insurance | — | — | 4,910,000 | — | — | — | ||||||||||||||||
| J. Michael Schlotman | ||||||||||||||||||||||
| Accrued and Banked Vacation | $ | 516,928 | $ | 516,928 | $ | 516,928 | $ | 516,928 | $ | 516,928 | $ | 516,928 | ||||||||||
| Severance | — | — | — | — | — | 2,581,080 | ||||||||||||||||
| Additional Vacation and Bonus | — | — | — | — | — | 45,622 | ||||||||||||||||
| Continued Health and Welfare Benefits(1) | — | — | — | — | — | 48,995 | ||||||||||||||||
| Stock Options(2) | — | — | 3,962,059 | 3,962,059 | 3,962,059 | 3,962,059 | ||||||||||||||||
| Restricted Stock(3) | — | — | 5,929,004 | 5,929,004 | 5,929,004 | 5,929,004 | ||||||||||||||||
| Performance Units(4) | — | 850,471 | 850,471 | 850,471 | 887,585 | 887,585 | ||||||||||||||||
| Long-Term Cash Bonus(5) | — | 743,335 | 743,335 | 743,335 | 747,500 | 747,500 | ||||||||||||||||
| Executive Group Life Insurance | — | — | 3,064,200 | — | — | — | ||||||||||||||||
| Michael J. Donnelly | ||||||||||||||||||||||
| Accrued and Banked Vacation | $ | 245,191 | $ | 245,191 | $ | 245,191 | $ | 245,191 | $ | 245,191 | $ | 245,191 | ||||||||||
| Severance | — | — | — | — | — | 2,345,731 | ||||||||||||||||
| Additional Vacation and Bonus | — | — | — | — | — | 42,451 | ||||||||||||||||
| Continued Health and Welfare Benefits(1) | — | — | — | — | — | 38,794 | ||||||||||||||||
| Stock Options(2) | — | — | 2,252,578 | 2,252,578 | 2,252,578 | 2,252,578 | ||||||||||||||||
| Restricted Stock(3) | — | — | 3,908,361 | 3,908,361 | 3,908,361 | 3,908,361 | ||||||||||||||||
| Performance Units(4) | — | 575,422 | 575,422 | 575,422 | 572,059 | 572,059 | ||||||||||||||||
| Long-Term Cash Bonus(5) | — | 650,008 | 650,008 | 650,008 | 653,230 | 653,230 | ||||||||||||||||
| Executive Group Life Insurance | — | — | 2,770,000 | — | — | — | ||||||||||||||||
| Christopher T. Hjelm | ||||||||||||||||||||||
| Accrued and Banked Vacation | $ | 53,848 | $ | 53,848 | $ | 53,848 | $ | 53,848 | $ | 53,848 | $ | 53,848 | ||||||||||
| Severance | — | — | — | — | — | 2,053,342 | ||||||||||||||||
| Additional Vacation and Bonus | — | — | — | — | — | 39,487 | ||||||||||||||||
| Continued Health and Welfare Benefits(1) | — | — | — | — | — | 48,101 | ||||||||||||||||
| Stock Options(2) | — | — | 2,156,403 | 2,156,403 | 2,156,403 | 2,156,403 | ||||||||||||||||
| Restricted Stock(3) | — | — | 3,730,340 | 3,730,340 | 3,730,340 | 3,730,340 | ||||||||||||||||
| Performance Units(4) | — | 637,879 | 637,879 | 637,879 | 665,727 | 665,727 | ||||||||||||||||
| Long-Term Cash Bonus(5) | — | 606,668 | 606,668 | 606,668 | 610,000 | 610,000 | ||||||||||||||||
| Executive Group Life Insurance | — | — | 3,165,000 | — | — | — | ||||||||||||||||
47
| Name | Involuntary Termination | Voluntary | Death | Disability | Change in Control without Termination | Change in Control with Termination | ||||||||||||||||||||
| Frederick J. Morganthall II | ||||||||||||||||||||||||||
| Accrued and Banked Vacation | $ | 77,310 | $ | 77,310 | $ | 77,310 | $ | 77,310 | $ | 77,310 | $ | 77,310 | ||||||||||||||
| Severance | — | — | — | — | — | 2,180,016 | ||||||||||||||||||||
| Additional Vacation and Bonus | — | — | — | — | — | 41,443 | ||||||||||||||||||||
| Continued Health and Welfare Benefits(1) | — | — | — | — | — | 27,484 | ||||||||||||||||||||
| Stock Options(2) | — | — | 19,180 | 19,180 | 19,180 | 19,180 | ||||||||||||||||||||
| Restricted Stock(3) | — | — | 5,721,797 | 5,721,797 | 5,721,797 | 5,721,797 | ||||||||||||||||||||
| Performance Units(4) | — | 478,038 | 478,038 | 478,038 | 452,195 | 452,195 | ||||||||||||||||||||
| Long-Term Cash Bonus(5) | — | 559,162 | 559,162 | 559,162 | 561,930 | 561,930 | ||||||||||||||||||||
| Executive Group Life Insurance | — | — | 2,295,000 | — | — | — | ||||||||||||||||||||
| (1) | Represents the aggregate present value of continued participation in the Company’s medical, dental and executive term life insurance plans, based on the premiums paid by the Company during the eligible period. The eligible period for continued medical and dental benefits is based on the length of service, which is 22 months for Mr. Hjelm, and 24 months for the other NEOs. The eligible period for continued executive term life insurance coverage is six months for all NEOs. The amounts reported may ultimately be lower if the executive is no longer eligible to receive benefits, which could occur upon obtaining other employment and becoming eligible for substantially equivalent benefits through the new employer. | |
| (2) | Amounts reported in the death, disability and change in control columns represent the intrinsic value of the accelerated vesting of unvested stock options, calculated as the difference between the exercise price of the stock option and the closing price per Kroger common share on January 29, 2016. In accordance with SEC rules, no amount is reported in the voluntary termination/retirement column because vesting is not accelerated, but the awards may continue to vest on the original schedule if the conditions described above are met. | |
| (3) | Amounts reported in the death, disability and change in control columns represent the aggregate value of the accelerated vesting of restricted stock. In accordance with SEC rules, no amount is reported in the voluntary termination/retirement column because vesting is not accelerated, but the awards may continue to vest on the original schedule if the conditions described above are met. | |
| (4) | Amounts reported in the voluntary termination/retirement, death and disability columns represent the aggregate value of the performance units granted in 2014 and 2015, based on the probable outcome of the performance conditions as of January 30, 2016 and prorated for the portion of the performance period completed. Amounts reported in the change in control column represent the aggregate value of 50% of the maximum number of performance units granted in 2014 and 2015 at the beginning of the performance period. Awards under the 2013 Long-Term Incentive Plan were earned as of the last day of 2015 so each NEO was entitled to receive (regardless of the triggering event) the amount actually earned, which is reported in the Stock Awards column of the 2015 Stock Vested Table. | |
| (5) | Amounts reported in the voluntary termination/retirement, death and disability columns represent the aggregate value of the long-term cash bonuses granted in 2014 and 2015, based on the probable outcome of the performance conditions as of January 30, 2016 and prorated for the portion of the performance period completed. Amounts reported in the change in control column represent the aggregate value of 50% of the long-term cash bonus potentials under the 2014 and 2015 Long-Term Incentive Plans. Awards under the 2013 Long-Term Incentive Plan were earned as of the last day of 2015, so each NEO was entitled to receive (regardless of the triggering event) the amount actually earned, which is reported in the Non-Equity Incentive Plan Compensation column of the Summary Compensation Table. | |
48
Item 2. Advisory Vote on Executive Compensation
You are being asked to vote, on an advisory basis, to approve the compensation of our NEOs. The Board of Directors recommends that you vote FOR the approval of compensation of our NEOs.
The Dodd-Frank Wall Street Reform and Consumer Protection Act, enacted in July 2010, requires that we give our shareholders the right to approve, on a nonbinding, advisory basis, the compensation of our NEOs as disclosed earlier in this proxy statement in accordance with the SEC’s rules.
As discussed furtherearlier in the Compensation Discussion and Analysis, section under the “Retirement and Other Benefits” heading.
Compensation Policies as They Relate to Risk Management
Kroger’sour compensation policies and practices for its employees are designedphilosophy is to attract and retain highly qualified and engaged employees,the best management talent and to minimize risksmotivate these employees to achieve our business and financial goals. Our incentive plans are designed to reward the actions that would havelead to long-term value creation. To achieve our objectives, we seek to ensure that compensation is competitive and that there is a material adverse effectdirect link between pay and performance. To do so, we are guided by the following principles:
| ● | A significant portion of pay should be performance-based, with the percentage of total pay tied to performance increasing proportionally with an executive’s level of responsibility; |
| ● | Compensation should include incentive-based pay to drive performance, providing superior pay for superior performance, including both a short- and long-term focus; |
| ● | Compensation policies should include an opportunity for, and a requirement of, equity ownership to align the interests of executives and shareholders; and |
| ● | Components of compensation should be tied to an evaluation of business and individual performance measured against metrics that directly drive our business strategy. |
The vote on this resolution is not intended to address any specific element of compensation. Rather, the vote relates to the compensation of our NEOs as described in this proxy statement. The vote is advisory. This means that the vote is not binding on Kroger. OneThe Compensation Committee of these policies, the Board is responsible for establishing executive compensation. In so doing that Compensation Committee will consider, along with all other relevant factors, the results of this vote.
We ask our shareholders to vote on the following resolution:
“RESOLVED, that the compensation recoupment policy, is more particularly described inpaid to the Company’s NEOs, as disclosed pursuant to Item 402 of Regulation S-K, including the Compensation Discussion and Analysis. Kroger does not believe that itsAnalysis, compensation policiestables, and practices create risks that are reasonably likely to have a material adverse effect on Kroger.the related narrative discussion, is hereby APPROVED.”
The next advisory vote will occur at our 2017 annual meeting.
44The Board of Directors Recommends a VoteFor This Proposal.
49
Director Compensation
2015 Director Compensation
The following table describes the 2015 compensation for non-employee directors. Mr. McMullen does not receive compensation for his Board service.
| Name | Fees Earned or Paid in Cash | Stock Awards(1) | Option Awards(1) | Change in Pension Value and Nonqualified Deferred Compensation Earnings(2) | Total | |||||||||||||||
| Nora A. Aufreiter | $ | 84,772 | $ | 165,586 | — | — | $ | 250,358 | ||||||||||||
| Robert D. Beyer | $ | 124,664 | $ | 165,586 | — | $ | 8,271 | $ | 298,521 | |||||||||||
| Anne Gates(3) | $ | 13,280 | $ | 98,136 | — | — | $ | 111,416 | ||||||||||||
| Susan J. Kropf | $ | 94,745 | $ | 165,586 | — | — | $ | 260,331 | ||||||||||||
| David B. Lewis | $ | 84,772 | $ | 165,586 | — | — | $ | 250,358 | ||||||||||||
| Jorge P. Montoya | $ | 99,731 | $ | 165,586 | — | — | $ | 265,317 | ||||||||||||
| Clyde R. Moore | $ | 104,718 | $ | 165,586 | — | $ | 11,753 | $ | 282,057 | |||||||||||
| Susan M. Phillips | $ | 94,745 | $ | 165,586 | — | $ | 2,701 | $ | 263,032 | |||||||||||
| James A. Runde | $ | 99,731 | $ | 165,586 | — | — | $ | 265,317 | ||||||||||||
| Ronald L. Sargent | $ | 114,691 | $ | 165,586 | — | $ | 2,777 | $ | 283,054 | |||||||||||
| Bobby S. Shackouls | $ | 94,745 | $ | 165,586 | — | — | $ | 260,331 | ||||||||||||
| (1) | Amounts reported in the Stock Awards column represent the aggregate grant date fair value of the annual incentive share award, computed in accordance with FASB ASC Topic 718. Options are no longer granted to non-employee directors. The aggregate number of previously granted stock options that remained unexercised and outstanding at fiscal year-end was as follows: |
| Name | Options | |
| Ms. Aufreiter | — | |
| Mr. Beyer | 85,000 | |
| Ms. Gates | — | |
| Ms. Kropf | 75,000 | |
| Mr. Lewis | 75,000 | |
| Mr. Montoya | 75,000 | |
| Mr. Moore | 65,000 | |
| Ms. Phillips | 85,000 | |
| Mr. Runde | 85,000 | |
| Mr. Sargent | 85,000 | |
| Mr. Shackouls | 7,800 |
| (2) | The amounts reported for Messrs. Beyer and Sargent and Dr. Phillips represent preferential earnings on nonqualified deferred compensation. For a complete explanation of preferential earnings, please refer to footnote 5 to the Summary Compensation Table. The amount reported for Mr. Moore represents the change in actuarial present value of his accumulated benefit under the pension plan for non-employee directors. | |
| (3) | Ms. Gates joined the Board in December 2015. Her retainer and incentive shares were prorated accordingly. | |
50
Annual Compensation
Each non-employee director receives an annual cash retainer of $85,000. The chairs of each of the Audit Committee and the Compensation Committee receive an additional annual cash retainer of $20,000. The chair of each of the other committees receives an additional annual cash retainer of $15,000. Each member of the Audit Committee receives an additional annual cash retainer of $10,000. The director designated as the Lead Director receives an additional annual cash retainer of $25,000.
Approximately $165,000 worth of incentive shares (Kroger common shares) are issued to non-employee directors as a portion of the directors’ overall compensation. On July 15, 2015, each non-employee director, except for Ms. Gates, received 4,320 common shares. Ms. Gates received 2,386 common shares on December 10, 2015 upon joining the Board.
The Board has determined that compensation of non-employee directors must be competitive on an ongoing basis to attract and retain directors who meet the qualifications for service on the Board. Non-employee director compensation will be reviewed from time to time as the Corporate Governance Committee deems appropriate.
Pension Plan
Non-employee directors first elected prior to July 17, 1997 receive an unfunded retirement benefit equal to the average cash compensation for the five calendar years preceding retirement. Only Mr. Moore is eligible for this benefit. Participants who retire from the Board prior to age 70 will be credited with 50% vesting after five years of service, and 10% for each additional year up to a maximum of 100%. Benefits for participants who retire prior to age 70 begin at the later of actual retirement or age 65.
Nonqualified Deferred Compensation
We also maintain a deferred compensation plan for non-employee directors. Participants may defer up to 100% of their cash compensation and/or the receipt of all (and not less than all) of the annual award of incentive shares.
Cash Deferrals
Cash deferrals are credited to a participant’s deferred compensation account. Participants may elect from either or both of the following two alternative methods of determining benefits:
| ● | interest accrues until paid out at the rate of interest determined prior to the beginning of the deferral year to represent Kroger’s cost of ten-year debt; and/or |
| ● | amounts are credited in “phantom” stock accounts and the amounts in those accounts fluctuate with the price of Kroger common shares. |
In both cases, deferred amounts are paid out only in cash, based on deferral options selected by the participant at the time the deferral elections are made. Participants can elect to have distributions made in a lump sum or in quarterly installments, and may make comparable elections for designated beneficiaries who receive benefits in the event that deferred compensation is not completely paid out upon the death of the participant.
Incentive Share Deferrals
Participants may also defer the receipt of all (and not less than all) of the annual award of incentive shares. Distributions will be made by delivery of Kroger common shares within 30 days after the date which is 6 months after the participant’s separation of service.
51
Beneficial Ownership of Common Stock
The following table sets forth the common shares beneficially owned as of February 14, 2014April 1, 2016 by Kroger’s directors, the named executive officers,NEOs, and the directors and executive officers as a group. The percentage of ownership is based on 512,053,904964,367,417 of the CompanyKroger common shares outstanding on February 14, 2014.April 1, 2016. Shares reported as beneficially owned include shares held indirectly through Kroger’s defined contribution plans and other shares held indirectly, as well as shares subject to stock options exercisable on or before May 31, 2016. Except as otherwise noted, each beneficial owner listed in the table has sole voting and investment power with regard to the common shares beneficially owned by such owner.
| Amount and Nature | ||
| of | ||
| Name | Beneficial Ownership | |
| Reuben V. Anderson | 109,490 | (1) |
| Kathleen S. Barclay | 119,816 | (2) |
| Robert D. Beyer | 151,637 | (1) |
| David B. Dillon | 2,587,845 | (2)(3)(4)(5) |
| Michael L. Ellis | 240,000 | (2)(3) |
| Paul W. Heldman | 365,788 | (2)(3)(6) |
| Susan J. Kropf | 54,120 | (7) |
| David B. Lewis | 70,622 | (8) |
| W. Rodney McMullen | 1,440,739 | (2)(3) |
| Jorge P. Montoya | 44,724 | (7) |
| Clyde R. Moore | 88,120 | (9) |
| Susan M. Phillips | 85,210 | (10) |
| Steven R. Rogel | 98,853 | (1) |
| James A. Runde | 62,620 | (8) |
| Ronald L. Sargent | 61,620 | (8) |
| J. Michael Schlotman | 290,011 | (2)(3)(5) |
| Bobby S. Shackouls | 59,120 | (11) |
| Directors and Executive Officers as a group (29 persons, | ||
| including those named above) | 7,322,242 | (2)(3) |
No director or officer owned as much as 1% of the common shares of Kroger. The directors and executive officers as a group beneficially owned 1% of the common shares of Kroger.____________________
| Name | Amount and Nature of Beneficial Ownership(1) (a) | Options | ||||||
| Nora A. Aufreiter(2) | 7,513 | — | ||||||
| Robert D. Beyer(2) | 295,682 | 77,200 | ||||||
| Michael J. Donnelly | 467,879 | 249,296 | ||||||
| Anne Gates | 2,386 | — | ||||||
| Christopher T. Hjelm | 379,250 | 141,152 | ||||||
| Susan J. Kropf | 137,460 | 67,200 | ||||||
| David B. Lewis(2) | 158,255 | 67,200 | ||||||
| W. Rodney McMullen | 3,292,520 | 1,041,184 | ||||||
| Jorge P. Montoya(3) | 101,362 | 67,200 | ||||||
| Clyde R. Moore | 145,860 | 57,200 | ||||||
| Frederick J. Morganthall II | 183,101 | — | ||||||
| Susan M. Phillips | 176,923 | 67,200 | ||||||
| James A. Runde | 154,460 | 77,200 | ||||||
| Ronald L. Sargent(2) | 152,630 | 77,200 | ||||||
| J. Michael Schlotman | 606,675 | 248,304 | ||||||
| Bobby S. Shackouls(2)(4) | 73,180 | — | ||||||
| Directors and executive officers as a group (29 persons, | ||||||||
| including those named above) | 8,187,350 | 2,998,844 | ||||||
| (1) | No director or | |
| (2) | This amount includes incentive share awards that were deferred under the deferred compensation plan for independent directors in the following amounts: Ms. Aufreiter, 4,357; Mr. Beyer, 6,833; Mr. Lewis, 11,190; Mr. Sargent, 11,190; Mr. Shackouls, 11,190. | |
| (3) | ||
| This amount includes | ||
| This amount includes | ||
4552
AsThe following table sets forth information regarding the beneficial owners of February 14, 2014, the following reported beneficial ownershipmore than five percent of Kroger common shares as of April 1, 2016 based on reports on Schedule 13G filed with the Securities and Exchange Commission or other reliable information as follows:SEC.
| Amount and | ||||||
| Nature of | Percentage | |||||
| Name | Address of Beneficial Owner | Ownership | of Class | |||
| BlackRock, Inc. (1) | 40 East 52ndStreet | 38,359,173 | 7.40% | |||
| New York, NY 10022 | ||||||
| FMR LLC (2) | 245 Summer Street | 37,604,848 | 7.28% | |||
| Boston, MA 02210 | ||||||
| The Kroger Co. Savings Plan | 1014 Vine Street | 26,231,418 | (3) | 5.12% | ||
| Cincinnati, OH 45202 | ||||||
| Name | Address of Beneficial Owner | Amount and Nature of Ownership | Percentage of Class | |||
| BlackRock, Inc.(1) | 55 East 52ndStreet | 66,134,371 | 6.80% | |||
| New York, NY 10055 | ||||||
| Vanguard Group Inc.(2) | 100 Vanguard Blvd | 54,699,370 | 5.61% | |||
| Malvern, PA 19355 |
| (1) | Reflects beneficial ownership by BlackRock Inc., as of December 31, | |
| (2) | Reflects beneficial ownership by | |
Section 16(a) Beneficial Ownership Reporting Compliance
Section 16(a) of the Securities Exchange Act of 1934 requires our officers and directors, and persons who own more than 10% of a registered class of our equity securities, to file reports of ownership and changes in ownership with the Securities and Exchange Commission.SEC. Those officers, directors and shareholders are required by SEC regulation to furnish us with copies of all Section 16(a) forms they file.
Based solely on our review of the copies of Forms 3 and 4 received by Kroger, and any written representations from certain reporting persons that no Forms 5 were required for those persons, we believe that during fiscal year 20132015 all filing requirements applicable to our executive officers, directors and 10% beneficial owners were timely satisfied, with the following exceptions.exception. In March 2013, Kathleen S. Barclay, Robert W. Clark, Geoffrey J. Covert, David B. Dillon, Michael J. Donnelly, Kevin M. Dougherty,August 2015, Michael L. Ellis, Paul W. Heldman, Scott M. Henderson, Christopher T. Hjelm, Calvin J. Kaufman, Lynn Marmer, W. Rodney McMullen, M. Marnette Perry, J. Michael Schlotman, Mary Elizabeth Van Oflen,who retired as President and R. Pete Williams wereChief Operating Officer of the Company in July 2015, was 2 days late
46
in the filing of Formsa Form 4 to report (i) share awards under Company performance unit agreements, and (ii) witha stock purchase in the exceptionamount of Mr. McMullen, share dispositions for tax liability related to said share awards; due to an administrative error by the Company. Also, in March 2013, Mark C. Tuffin filed a Form 5 to report 4,000 shares held directly that inadvertently were not reported on his Form 3 filing and a subsequent Form 3/A and Form 4 filing.500 shares.
Related Person Transactions
Under ourStatement of Policy with Respect to Related Person Transactions and the rules of the SEC, the Audit Committee approved the following related party transaction:
Director independence is discussed above under the heading “Information Concerning the Board of Directors.” Kroger’swritten policy on related person transactions is as follows:
Statement of Policywith Respect toRelated Person Transactions
A. Introduction
It is the policy of Kroger’s Board of Directorsrequiring that any Related Person Transaction may be consummated or may continue only if the Audit Committee approves or ratifies the transaction in accordance with the guidelines set forth in this policy. The Board of Directors has determined that the Audit Committee of the Board is best suited to review and approve Related Person Transactions.
For the purposes of this policy, a “Related Person” is:
For the purposes of this policy, aA “Related Person Transaction” is a transaction, arrangement or relationship (or any series of similar transactions, arrangements or relationships) since the beginning of Kroger’s last fiscal yearone (a) involving Kroger, (b) in which Kroger (including anyone of its subsidiaries) was, isour directors, nominees for director, executive officers, or will be a participant and the amount involved exceeds $120,000, and in which any Related Person had, hasgreater than five percent shareholders, or willtheir immediate family members, have a direct or indirect material interest (other than solely as a result of being a director or a less than 10 percent beneficial owner of another entity).
47
Notwithstanding the foregoing, the Audit Committee has reviewed the following types of transactionsinterest; and has determined that each type of transaction is deemed to be pre-approved, even if(c) the amount involved exceeds $120,000.$120,000 in a fiscal year.
B.The Audit Committee Approval
In the event management becomes aware of anywill approve only those Related Person Transactions that are in, or not deemed pre-approved under paragraph Ainconsistent with, the best interests of this policy, those transactions will be presented to the Committee for approval at the next regular Committee meeting, or where it is not practicable or desirable to wait until the next regular Committee meeting, to the Chair of the Committee (who will possess delegated authority to act between Committee meetings) subject to ratificationKroger and its shareholders, as determined by the Audit Committee atin good faith in accordance with its next regular meeting. If advancebusiness judgment. No director may participate in any review, approval or ratification of any transaction if he or she, or an immediate family member, has a Related Person Transaction is not feasible, thendirect or indirect material interest in the Related Person Transaction will be presented to the Committee for ratification at the next regular Committee meeting, or where it is not practicable or desirable to wait until the next regular Committee meeting, to the Chair of the Committee for ratification, subject to further ratification by the Committee at its next regular meeting.transaction.
In connection with each regular Committee meeting, a summary of each new Related Person Transaction deemed pre-approved pursuant to paragraphs A(1) and A(2) above will be provided to the Committee for its review.
IfWhere a Related Person Transaction will be ongoing, the Audit Committee may establish guidelines for management to follow in its ongoing dealings with the Related Person. Thereafter,related person and the Audit Committee on at least an annual basis, will review and assess ongoing relationshipsthe relationship on an annual basis to ensure it complies with the Related Person to see that they are in compliance with the Committee’ssuch guidelines and that the Related Person Transaction remains appropriate.
4853
Item No. 3 Ratification of the Appointment of Kroger’s Independent Auditor
You are being asked to ratify the appointment of Kroger’s independent auditor, PricewaterhouseCoopers LLC. The Board of Directors recommends that you vote FOR the ratification of PricewaterhouseCoopers LLP as our independent registered public accounting firm.
The primary function of the Audit Committee (oris assist the Chair) will approve only those Related Person TransactionsBoard of Directors in fulfilling its oversight responsibilities regarding the Company’s financial reporting and accounting practices including the integrity of the Company’s financial statements; the Company’s compliance with legal and regulatory requirements; the independent public accountants’ qualifications and independence; the performance of the Company’s internal audit function and independent public accountants; and the preparation of the Audit Committee Report. The Audit Committee performs this work pursuant to a written charter approved by the Board of Directors. The Audit Committee charter most recently was revised during fiscal 2012 and is available on the Company’s website at ir.kroger.com under Corporate Governance – Committee Composition. The Audit Committee has implemented procedures to assist it during the course of each fiscal year in devoting the attention that areis necessary and appropriate to each of the matters assigned to it under the Committee’s charter. The Audit Committee held five meetings during fiscal year 2015.
Selection of Independent Auditor
The Audit Committee of the Board of Directors is directly responsible for the appointment, compensation, retention, and oversight of Kroger’s independent auditor, as required by law and by applicable NYSE rules. On March 9, 2016, the Audit Committee appointed PricewaterhouseCoopers LLP as Kroger’s independent auditor for the fiscal year ending January 28, 2017.
In determining whether to reappoint the independent auditor, our Audit Committee:
| ● | Reviews PricewaterhouseCoopers LLP’s independence and performance; |
| ● | Reviews, in advance, all non-audit services provided by PricewaterhouseCoopers LLP, specificallywith regard to the effect on the firm’s independence; |
| ● | Conducts an annual assessment of PricewaterhouseCoopers LLP’s performance, including aninternal survey of their service quality by members of management and the Audit Committee; |
| ● | Conducts regular executive sessions with PricewaterhouseCoopers LLP; |
| ● | Conducts regular executive sessions with the Vice President of Internal Audit; |
| ● | Considers PricewaterhouseCoopers LLP’s familiarity with our operations, businesses, accountingpolicies and practices and internal control over financial reporting; |
| ● | Reviews candidates for the lead engagement partner in conjunction with the mandated rotation ofthe public accountants’ lead engagement partner; |
| ● | Reviews recent Public Company Accounting Oversight Board reports on PricewaterhouseCoopersLLP and its peer firms; and |
| ● | Obtains and reviews a report from PricewaterhouseCoopers LLP describing all relationshipsbetween the independent auditor and Kroger at least annually to assess the independence of theinternal auditor. |
As a result, the members of the Audit Committee believe that the continued retention ofPricewaterhouseCoopers LLP to serve as our independent registered public accounting firm is in or are not inconsistent with, the best interests of Krogerour company and its shareholders.
While shareholder ratification of the selection of PricewaterhouseCoopers LLP as our independent auditor is not required by Kroger’s Regulations or otherwise, the Board of Directors is submitting the selection of PricewaterhouseCoopers LLP to shareholders for ratification, as it has in past years, as a good corporate governance practice. If the shareholders fail to ratify the selection, the Audit Committee
54
may, but is not required to, reconsider whether to retain that firm. Even if the selection is ratified, the Audit Committee (orin its discretion may direct the Chair) determines in good faith in accordance with its business judgment.
No director will participate in any discussion or approvalappointment of a Related Person Transaction for whichdifferent auditor at any time during the year if it determines that such a change would be in the best interests of our company and our shareholders.
A representative of PricewaterhouseCoopers LLP is expected to be present at the meeting to respond to appropriate questions and to make a statement if he or she or an immediate family member (as defined above), is a Related Person exceptdesires to do so.
Audit and Non-Audit Fees
The following table presents the aggregate fees billed for professional services performed by PricewaterhouseCoopers LLP for the annual audit and quarterly reviews of our consolidated financial statements for fiscal 2015 and 2014, and for audit-related, tax and all other services performed in 2015 and 2014.
| Fiscal Year Ended | ||||||||||
| January 30, 2016 | January 31, 2015 | |||||||||
| Audit Fees(1) | $ | 5,659,193 | $ | 5,250,203 | ||||||
| Audit-Related Fees(2) | — | 441,704 | ||||||||
| Tax Fees(3) | — | 360,498 | ||||||||
| All Other Fees(4) | — | 85,000 | ||||||||
| Total | $ | 5,659,193 | $ | 6,137,405 | ||||||
| (1) | Includes annual audit and quarterly reviews of Kroger’s consolidated financial statements, the issuance of comfort letters to underwriters, consents, and assistance with review of documents filed with the SEC. | |
| (2) | Includes assurance and related services pertaining to accounting consultation in connection with attest services that are not required by statute or regulations, and consultation concerning financial accounting and reporting standards. These fees also included services related to acquisition related due diligence. | |
| (3) | Includes state tax compliance, tax audit support and debt restructuring. | |
| (4) | Includes fees for fiscal 2014 for advisory services pertaining to retiree healthcare benefits. | |
The Audit Committee requires that it approve in advance all audit and non-audit work performed by PricewaterhouseCoopers LLP. On March 9, 2016, the director will provide all material information aboutAudit Committee approved services to be performed by PricewaterhouseCoopers LLP for the Related Person Transactionremainder of fiscal year 2015 that are related to the Committee.audit of Kroger or involve the audit itself. In 2007, the Audit Committee adopted an audit and non-audit service pre-approval policy. Pursuant to the terms of that policy, the Committee will annually pre-approve certain defined services that are expected to be provided by the independent auditors. If it becomes appropriate during the year to engage the independent accountant for additional services, the Audit Committee must first approve the specific services before the independent accountant may perform the additional work.
PricewaterhouseCoopers LLP has advised the Audit Committee that neither the firm, nor any member of the firm, has any financial interest, direct or indirect, in any capacity in Kroger or its subsidiaries.
C. DisclosureThe Board of Directors Recommends a VoteFor This Proposal.
Kroger will disclose all Related Person Transactions in Kroger’s applicable filings as required by the Securities Act of 1933, the Securities Exchange Act of 1934 and related rules.55
Audit Committee Report
The primary function of the Audit Committee is to represent and assist the Board of Directors in fulfilling its oversight responsibilities regarding the Company’s financial reporting and accounting practices including the integrity of the Company’s financial statements; the Company’s compliance with legal and regulatory requirements; the independent public accountants’ qualifications and independence; the performance of the Company’s internal audit function and independent public accountants; and the preparation of this report that SEC rules require be included in the Company’s annual proxy statement. The Audit Committee performs this work pursuant to a written charter approved by the Board of Directors. The Audit Committee charter most recently was revised during fiscal 2012 and is available on the Company’s website at ir.kroger.com. The Audit Committee has implemented procedures to assist it during the course of each fiscal year in devoting the attention that is necessary and appropriate to each of the matters assigned to it under the Committee’s charter. The Audit Committee held five meetings during fiscal year 2013. The Audit Committee meets separately with the Company’s internal auditor and PricewaterhouseCoopers LLP, the Company’s independent public accountants, without management present, to discuss the results of their audits, their evaluations of the Company’s internal controls over financial reporting, and the overall quality of the Company’s financial reporting. The Audit Committee also meets separately with the Company’s Chief Financial Officer and General Counsel when needed. Following these separate discussions, the Audit Committee meets in executive session.
Management of the Company is responsible for the preparation and presentation of the Company’s financial statements, the Company’s accounting and financial reporting principles and internal controls, and procedures that are designed to provide reasonable assurance regarding compliance with accounting standards and applicable laws and regulations. The independent public accountants are responsible for auditing the Company’s financial statements and expressing opinions as to the financial statements’ conformity with generally accepted accounting principles and the effectiveness of the Company’s internal control over financial reporting.
In the performance ofperforming its oversight function,functions, the Audit Committee has reviewed and discussed with management and PricewaterhouseCoopers LLP the audited financial statements for the year ended February 1, 2014, management’s assessment of the effectiveness of the Company’s internal control over financial reporting as of February 1, 2014, and PricewaterhouseCoopers’ evaluation of the Company’s internal control over financial reporting as of that date. The Audit Committee has also discussed with the independent public accountants the matters that the independent public accountants must communicate to the Audit Committee under applicable requirements of the Public Company Accounting Oversight Board.Committee:
| ● | Met separately with the Company’s internal auditor and PricewaterhouseCoopers LLP with andwithout management present to discuss the results of the audits, their evaluation and management’sassessment of the effectiveness of Kroger’s internal controls over financial reporting and the overallquality of the Company’s financial reporting; |
| ● | Met separately with the Company’s Chief Financial Officer or the Company’s General Counselwhen needed; |
| ● | Met regularly in executive sessions; |
| ● | Reviewed and discussed with management the audited financial statements included in ourAnnual Report; |
| ● | Discussed with PricewaterhouseCoopers LLP the matters required to be discussed under theapplicable requirements of the Public Company Accounting Oversight Board; |
| ● | Received the written disclosures and the letter from PricewaterhouseCoopers LLP required by theapplicable requirements of the Public Accounting Oversight Board regarding the independent publicaccountant’s communication with the Audit Committee concerning independence and discussedwith them matters related to their independence; and |
With respect to the Company’s independent public accountants, the Audit Committee, among other things, discussed with PricewaterhouseCoopers LLP matters relating to its independence and has received the written disclosures and the letter from the independent public accountants required by applicable requirements of the Public Company Accounting Oversight Board regarding the independent public accountants’ communications with the Audit Committee concerning independence. The Audit Committee has reviewed and approved in advance all services provided to the Company by PricewaterhouseCoopers LLP.
The Audit Committee annually reviews PricewaterhouseCoopers LLP’s independence and performance in connection with the Audit Committee’s responsibility for the appointment and oversight of the Company’s independent public accountants. The Audit Committee considers, among other things, PricewaterhouseCoopers LLP’s historical and recent performance on the Company’s audit, including an internal survey of their service
49
quality by members of management and the Audit Committee. The Audit Committee reviews recent Public Company Accounting Oversight Board reports on PricewaterhouseCoopers LLP and its peer firms, and considers PricewaterhouseCoopers LLP’s tenure as the Company’s independent public accountants and their familiarity with our operations, businesses, accounting policies and practices and internal control over financial reporting. Further, in conjunction with the mandated rotation of the public accountants’ lead engagement partner, the Audit Committee is directly involved in the selection of PricewaterhouseCoopers LLP’s lead engagement partner every five years. The Audit Committee believes that the continued retention of PricewaterhouseCoopers LLP to serve as the Company’s independent public accountants is in the best interests of the Company and its shareowners.
Based upon the review and discussions described in this report, the Audit Committee recommended to the Board of Directors that the audited consolidated financial statements be included in the Company’s Annual Report on Form 10-K for the year ended February 1, 2014,January 30, 2016, as filed with the SEC.
This report is submitted by the Audit Committee.
Ronald L. Sargent, Chair
Anne Gates
Susan J. Kropf
Susan M. Phillips
Bobby S. Shackouls
Approval of the 2014 Long-Term Incentive and Cash Bonus Plan(Item No. 2)
The Board of Directors has adopted, subject to shareholder approval, The Kroger Co. 2014 Long-Term Incentive and Cash Bonus Plan (“Plan”) for which a maximum of 25,000,000 shares are reserved. The purpose of the Plan is to assist in attracting and retaining employees and directors of outstanding ability and to align their interests with those of the shareholders of Kroger. If approved, the Plan will be effective as of June 26, 2014.
Description of the Plan
General. The Plan consists of two separate equity-based programs; the Insider Program and the Non-Insider Program. Officers and directors of Kroger subject to Section 16(a) of the Securities Exchange Act of 1934 (the “Exchange Act”) are eligible for grants or awards under the Insider Program while all other employees of Kroger are eligible for grants or awards under the Non-Insider Program. As of the date of this proxy statement, 29 employees and directors are eligible to participate in the Insider Program and the remaining approximately 375,000 employees of Kroger are eligible to participate in the Non-Insider Program. In addition, the Plan provides for a performance-based Cash Bonus Program in which all 375,000 employees are eligible to participate. Shareholders last approved a similar plan, providing for issuance of a maximum of 25,000,000 shares, at the annual meeting of shareholders held in June 2011. Kroger intends for shares under these plans to be sufficient for grants and awards made in the ordinary course for a period of three to four years. Options may not be issued below the fair market value of a Kroger common share on the date of the grant. Options and stock appreciation rights may not be repriced.
Administration. The Insider Program will be administered by a committee of the Board of Directors that meets the standards of Rule 16b-3(d)(1) under the Exchange Act and initially will be the Compensation Committee of the Board of Directors, made up exclusively of independent directors. The Non-Insider Program will be administered by a committee of three officers appointed by the Chief Executive Officer, the members of which are ineligible to receive grants or awards under the Non-Insider Program. The administering committee in each case is referred to as the “Committee.” The Cash Bonus Program will be administered by the Committee under the Insider Program. The Plan is drafted to maintain the maximum amount of flexibility with the Committee determining the ultimate provisions of each grant or award.
The Committee is authorized to award or grant nonstatutory stock options, stock appreciation rights, performance units, restricted stock and incentive shares to participants under the Insider Program and the Non-Insider Program, and to award performance-based cash bonuses under the Cash Bonus Program. The Committee will determine the types and amounts of awards or grants, the recipients of awards or grants, vesting schedules, restrictions, performance criteria, and other provisions of the grants or awards. All of these provisions will be set forth in a written instrument.
50
In addition to other rights of indemnification they may have as directors or employees of Kroger, members of the Committee will be indemnified by Kroger for reasonable expenses incurred in connection with defense of any action brought against them by reason of action taken or failure to act under or in connection with the Plan or any grant or award thereunder, if the members acted in good faith and in a manner that they believed to be in the best interest of Kroger.
The Board of Directors may terminate or amend the Plan at any time without shareholder approval, except that it may not amend the Plan without shareholder approval if required by applicable law, regulations, or rules of the principal exchange or interdealer quotation system on which Kroger’s common shares are listed or quoted. Unless earlier terminated by the Board of Directors, the Plan will terminate on March 13, 2024. Termination of the Plan will have no effect on the validity of any options, stock appreciation rights, performance units, restricted stock or incentive shares outstanding on the date of termination.
Unless otherwise provided in the agreement, awards and grants will not be transferable other than by will or the laws of descent and distribution.
Shares Subject to Grant. Under the Plan, up to 25,000,000 authorized but unissued or reacquired common shares may be issued upon the exercise of stock options, stock appreciation rights, performance units, or awarded as restricted stock or incentive shares. In no event may any participant receive awards and grants totaling more than 3,750,000 common shares in the aggregate under the Plan. The maximum number of shares that may be issued as restricted stock, incentive shares, or performance units under the Plan is 10,000,000 in the aggregate. However, the Committee under the Insider Program may increase this number, but for each share issued for such purpose in excess of 10,000,000, the number of shares that may be issued under the Plan will be reduced by four shares.
If an option, stock appreciation right, or performance unit expires or terminates without having been fully issued, or if restricted stock or incentive shares are not issued or are forfeited prior to the payment of a dividend on those shares to a participant, the shares not exercised, unissued or forfeited, as the case may be, will generally become available for other grants or awards under the Plan.
Stock Options. Nonstatutory stock options granted under the Plan will have exercise prices not less than the greater of the fair market value per common share or the par value of a common share, a term of not more than 10 years after the date of grant, and may not be exercised before six months from the date of grant. The Plan prohibits the “repricing” of stock options. Subject to the terms of the Plan, the Committee determines the vesting schedule and other terms and conditions applicable to stock options granted to employees. In recent years, option grants generally have not become exercisable earlier than one year from the date of grant. An eligible participant may receive more than one grant of options.
The Committee may in its discretion provide for the payment of the option exercise price otherwise than in cash, including by delivery of common shares, valued at their fair market value on the date of exercise, or by a combination of both cash and common shares.
Stock Appreciation Rights. Stock appreciation rights may be granted in connection with the grant of a nonstatutory option under the Plan (“related rights”). In the Committee’s sole discretion, a related right may apply to all or a portion of the common shares subject to the related option. Stock appreciation rights may also be granted independently of any option granted under the Plan. A stock appreciation right entitles the grantee upon exercise to elect to receive in cash, common shares or a combination thereof, the excess of the fair market value of a specified number of common shares at the time of exercise over the fair market value of such number of shares at the time of grant, or, in the case of a related right, the exercise price provided in the related option. To the extent required to comply with the requirements of Rule 16b-3 under the Exchange Act or otherwise provided in an agreement under the Plan, the Committee will have sole discretion to consent to or disapprove the election of any grantee to receive cash in full or partial settlement of a right. A stock appreciation right generally will not be exercisable until at least six months from the date of grant and will have a term of not more than ten years from the date of grant (or, in the case of a related right, not beyond the expiration of the related option). The Plan prohibits the “repricing” of stock appreciation rights.
51
Performance Units. Performance units may be granted in connection with the grant of a nonstatutory stock option under the Plan (“related performance unit”). In the Committee’s sole discretion, a related performance unit may apply to all or a portion of the common shares subject to the related option. Performance units may also be granted independently of any option granted under the Plan. In connection with the grant of performance units, the Committee will establish Performance Goals (as defined below) for a specified period.
Upon the exercise of performance units, or automatically upon satisfaction of the performance goals as set forth in an agreement for the performance units, a grantee will be entitled to receive the payment of such units in accordance with the terms of the award in common shares, cash, or a combination thereof, as the Committee may determine. The values generally will depend upon the extent to which the performance goals for the specified period have been satisfied, as determined by the Committee. Performance goals may be particular to a grantee or the department, branch, subsidiary or other unit in which the grantee works, or may be based on the performance of Kroger generally and may cover such periods as may be specified by the Committee. For purposes of the Plan, “Performance Goals” means performance goals established by the Committee which may be based on (i) earnings or earnings per share of Kroger, a unit of Kroger, or designated projects; (ii) total sales, identical sales, or comparable sales of Kroger, a unit of Kroger, or designated projects; (iii) cash flow; (iv) cash flow from operations; (v) operating profit or income; (vi) net income; (vii) operating margin; (viii) net income margin; (ix) return on net assets; (x) economic value added; (xi) return on total assets; (xii) return on common equity; (xiii) return on total or invested capital; (xiv) total shareholder return; (xv) revenue; (xvi) revenue growth; (xvii) earnings before interest, taxes, depreciation and amortization (“EBITDA”); (xviii) EBITDA growth; (xix) funds from operations per share and per share growth; (xx) cash available for distribution; (xxi) cash available for distribution per share and per share growth; (xxii) share price performance on an absolute basis and relative to an index of earnings per share or improvements in Kroger’s attainment of expense levels; (xxiii) reduction in operating costs as a percentage of sales; (xxiv) performance in key categories; (xxv) implementing or completion of strategic initiatives or critical projects; and (xxvi) key category performance as measured by the results of surveys of customers or associates, or any other objective goals established by the Committee, and may be absolute in their terms or measured against or in relationship to other companies similarly or otherwise situated. Performance units may be exercised only upon the achievement of minimum Performance Goals during the period as determined by the Committee. The Committee will determine the period during which performance units are exercisable and specifically set forth such period in any agreement granting performance units to a participant in the Plan, provided, however, that a performance unit generally may not be exercised until the expiration of at least six months from the date of grant. Performance units will expire no later than ten years from the date of grant (or in the case of a related performance unit, the expiration of the related option). Any performance units paid in the form of cash are deemed to be paid in common shares, with the number of shares being deemed paid equal to the amount of cash paid to the employee divided by the fair market value of a common share on the date of payment.
Restricted Stock.The Committee may award restricted stock to participants. The stock will be subject to forfeiture, restrictions on transferability, and other restrictions as specified in the agreement. The Committee has authority to impose other terms and conditions as it may determine in its discretion including making the vesting of awards contingent on the achievement of Performance Goals. During the period that a restricted stock award is subject to restrictions, an employee has the right to vote the shares and receive dividends.
Incentive Shares. The Committee may grant incentive shares to participants. Incentive share awards will consist of common shares issued or to be issued at such times, subject to achievement of such Performance Goals or other goals, or without condition, and on such other terms and conditions as the Committee deems appropriate and specifies in an agreement relating thereto.
Cash Bonuses. Two types of bonuses can be awarded under the Cash Bonus Program; an annual bonus award for each fiscal year, and a long-term bonus award for measurement periods in excess of one year. Bonus payments are based on Kroger’s performance measured against Performance Goals established by the Committee. The Committee establishes a bonus “potential” for each bonus payable under the Cash Bonus Program for each participant, based on the participant’s level within Kroger, and actual payouts can exceed that amount when Kroger’s performance exceeds the pre-established thresholds. Initially the Performance Goals for annual bonuses will include the following components: (i) EBITDA; (ii) identical sales; (iii) achievement
52
of strategic initiatives; and (iv) achievement of supermarket fuel center goals for EBITDA, gallons sold, and number of fuel centers. Initially the Performance Goals for long-term bonuses will include the following components: (i) performance in four key categories in Kroger’s strategic plan, (ii) reduction in operating costs as a percentage of sales, (iii) performance in categories designed to measure associate engagement, and (iv) return on invested capital. No single Cash Bonus to a participant may exceed $5,000,000.
Certain Federal Income Tax Consequences
Nonstatutory Stock Options, Stock Appreciation Rights, and Performance Units. A grantee will not recognize income on the grant of a nonstatutory stock option, stock appreciation right or performance unit, but generally will recognize ordinary income upon the exercise thereof. The amount of income recognized upon the exercise of a nonstatutory stock option generally will be measured by the excess, if any, of the fair market value of the shares at the time of exercise over the exercise price, provided the shares issued are either transferable or not subject to a substantial risk of forfeiture. The amount of income recognized upon the exercise of a stock appreciation right or a performance unit, in general, will be equal to the amount of cash received and the fair market value of any shares received at the time of exercise, provided the shares issued are either transferable or not subject to a substantial risk of forfeiture, plus the amount of any taxes withheld. Under certain circumstances, income on the exercise of a performance unit will be deferred if the grantee makes a proper election to defer such income. In some cases the recognition of income by a grantee from the exercise of a performance unit may be delayed for up to six months if a sale of the shares would subject the grantee to suit under Section 16(b) of the Exchange Act unless the grantee elects to recognize income at the time of receipt of such shares. In either case, the amount of income recognized is measured with respect to the fair market value of the common stock at the time the income is recognized.
In the case of ordinary income recognized by a grantee as described above in connection with the exercise of a nonstatutory stock option, a stock appreciation right, or a performance unit, Kroger will be entitled to a deduction in the amount of ordinary income so recognized by the grantee. Kroger will report the income to be recognized by grantee and will withhold the appropriate taxes.
Incentive Shares and Restricted Stock.A grantee of incentive shares or restricted stock is not required to include the value of such shares in ordinary income until the first time the grantee’s rights in the shares are transferable or are not subject to a substantial risk of forfeiture, whichever occurs earlier, unless the grantee elects to be taxed on receipt of the shares. In either case, the amount of such income will be equal to the excess of the fair market value of the stock at the time the income is recognized over the amount paid for the stock. Kroger will be entitled to a deduction in the amount of the ordinary income recognized by the grantee for Kroger’s taxable year which includes the last day of the grantee’s taxable year in which such grantee recognizes the income. Kroger will report the income to be recognized by grantee and will withhold the appropriate taxes.
General.The rules governing the tax treatment of options, stock appreciation rights, performance units, incentive shares and restricted stock and stock acquired upon the exercise of options, stock appreciation rights and performance units are quite technical, so that the above description of tax consequences is necessarily general in nature and does not purport to be complete. Moreover, statutory provisions are, of course, subject to change, as are their interpretations, and their application may vary in individual circumstances. Finally, the tax consequences under applicable state law may not be the same as under the federal income tax laws.
Tax Deductibility Cap. Section 162(m) of the Code provides that certain compensation received in any year by a “covered employee” in excess of $1,000,000 is non-deductible by Kroger for federal income tax purposes. Section 162(m) provides an exception, however, for “performance-based compensation.” To the extent practicable under the circumstances, the Committee currently intends to structure grants and awards made under the Plan to “covered employees” as performance-based compensation that is exempt from Section 162(m).
This summary of the 2014 Long-Term Incentive and Cash Bonus Plan is qualified in its entirety by the complete text of the Plan that is set forth in Appendix 1 of this Proxy Statement.
5356
Existing PlansItem No. 4 Shareholder Proposal
As of our fiscal year ended February 1, 2014, there were 16,171,099 shares remaining for future issuance under existing equity compensation plans. Of these shares, 5,103,640 were available for awards other than options or stock appreciation rights. Under some of these plans, this sublimit on full value shares can be increased by decreasing by four the total number of shares issuable under the plan for each such increased share.
The Board of Directors Recommends a VoteFor this Proposal.
New Plan Benefits
| 2014 Long-Term Incentive | ||||
| and Cash Bonus Plan | ||||
| Name and Position (1) | Dollar value ($) | Number of Units | ||
| All Groups | (1) | (1) | ||
Equity Compensation Plan Information
The following table provides information regarding shares outstanding and available for issuance under the Company’s existing equity compensation plans.
| (a) | (c) | ||||||||||||
| Number of | Number of securities | ||||||||||||
| securities | (b) | remaining for future | |||||||||||
| to be issued | Weighted-average | issuance under equity | |||||||||||
| upon exercise of | exercise price of | compensation plans | |||||||||||
| outstanding options, | outstanding | (excluding securities | |||||||||||
| warrants and rights | options, warrants | reflected in column | |||||||||||
| Plan Category | (1) | and rights | (a))(2) | ||||||||||
| Equity compensation plans approved by | |||||||||||||
| security holders | 22,863,444 | $ | 25.66 | 16,171,099 | |||||||||
| Equity compensation plans not approved by | |||||||||||||
| security holders | — | $ | — | — | |||||||||
| Total | 22,863,444 | $ | 25.66 | 16,171,099 | |||||||||
54
Advisory Vote on Executive Compensation(Item No. 3)
The Dodd-Frank Wall Street Reform and Consumer Protection Act, enacted in July 2010, requires that we give our shareholders the right to approve, on a nonbinding, advisory basis, the compensation of our named executive officers as disclosed earlier in this proxy statement in accordance with the SEC’s rules.
As discussed earlier in ourCompensation Discussion and Analysis, our compensation philosophy is to:
Furthermore, as previously disclosed, an increased percentage of total potential compensation is performance-based as opposed to time-based as half of the compensation previously awarded to the named executive officers as restricted stock (and earned based on the passage of time) is now only earned to the extent that performance goals are achieved. In addition, annual and long-term cash bonuses are performance-based and earned only to the extent that performance goals are achieved. In addition, annual and long-term cash bonuses are performance-based and earned only to the extent that performance goals are achieved. In tying a large portion of executive compensation to achievement of short-term and long-term strategic and operational goals, we seek to closely align the interests of our named executive officers with the interests of our shareholders.
The vote on this resolution is not intended to address any specific element of compensation. Rather, the vote relates to the compensation of our named executive officers as described in this proxy statement. The vote is advisory. This means that the vote is not binding on Kroger. The Compensation Committee of our Board of Directors is responsible for establishing executive compensation. In so doing that Committee will consider, along with all other relevant factors, the results of this vote.
We ask our shareholders to vote on the following resolution:
“RESOLVED, that the compensation paid to the Company’s named executive officers, as disclosed pursuant to Item 402 of Regulation S-K, including the Compensation Discussion and Analysis, compensation tables, and the related narrative discussion, is hereby APPROVED.”
The Board of Directors Recommends a VoteFor This Proposal.
Selection of Auditors(Item No. 4)
The Audit Committee of the Board of Directors is responsible for the appointment, compensation and retention of Kroger’s independent auditor, as required by law and by applicable NYSE rules. On March 12, 2014, the Audit Committee appointed PricewaterhouseCoopers LLP as Kroger’s independent auditor for the fiscal year ending January 31, 2015. While shareholder ratification of the selection of PricewaterhouseCoopers LLP as Kroger’s independent auditor is not required by Kroger’s Regulations or otherwise, the Board of Directors is submitting the selection of PricewaterhouseCoopers LLP to shareholders for ratification, as it has in past years, as a good corporate governance practice. If the shareholders fail to ratify the selection, the Audit Committee may, but is not required to, reconsider whether to retain that firm. Even if the selection is ratified, the Audit Committee in its discretion may direct the appointment of a different auditor at any time during the year if it determines that such a change would be in the best interests of Kroger and its shareholders.
A representative of PricewaterhouseCoopers LLP is expected to be present at the meeting to respond to appropriate questions and to make a statement if he or she desires to do so.
The Board of Directors Recommends a VoteFor This Proposal.
55
Disclosure of Auditor Fees
The following describes the fees billed to Kroger by PricewaterhouseCoopers LLP related to the fiscal years ended February 1, 2014 and February 2, 2013:
| Fiscal Year 2013 | Fiscal Year 2012 | ||||||||
| Audit Fees | $ | 5,151,390 | $ | 4,428,204 | |||||
| Audit-Related Fees | 151,878 | 45,993 | |||||||
| Tax Fees | 188,021 | — | |||||||
| All Other Fees | — | — | |||||||
| Total | $ | 5,491,289 | $ | 4,474,197 | |||||
Audit Fees for the years ended February 1, 2014 and February 2, 2013, respectively, were for professional services rendered for the audits of Kroger’s consolidated financial statements, the issuance of comfort letters to underwriters, consents, and assistance with the review of documents filed with the SEC.
Audit-Related Fees. Audit related services for the year ended February 1, 2014 were for assurance and related services pertaining to accounting consultation in connection with attest services that are not required by statute or regulation, and consultations concerning financial accounting and reporting standards. These services are considered approved under the Company’s existing Audit and Non-Audit Service Pre-Approval Policy. These fees also included services related to acquisition related due diligence which were approved by the Audit Committee in June 2013.
Tax Feesfor the year ended February 1, 2014 were for tax audit support and debt restructuring. We did not engage PricewaterhouseCoopers LLP for any tax services for the year ended February 2, 2013.
All Other Fees. We did not engage PricewaterhouseCoopers LLP for other services for the years ended February 1, 2014 and February 2, 2013.
The Audit Committee requires that it approve in advance all audit and non-audit work performed by PricewaterhouseCoopers LLP. On March 12, 2014, the Audit Committee approved services to be performed by PricewaterhouseCoopers LLP for the remainder of fiscal year 2014 that are related to the audit of Kroger or involve the audit itself. In 2007, the Audit Committee adopted an audit and non-audit service pre-approval policy. Pursuant to the terms of that policy, the Committee will annually pre-approve certain defined services that are expected to be provided by the independent auditors. If it becomes appropriate during the year to engage the independent accountant for additional services, the Audit Committee must first approve the specific services before the independent accountant may perform the additional work.
PricewaterhouseCoopers LLP has advised the Audit Committee that neither the firm, nor any member of the firm, has any financial interest, direct or indirect, in any capacity in Kroger or its subsidiaries.
Shareholder Proposal(Item No. 5)
We have been notified by fivenine shareholders, the names and shareholdings of which will be furnished promptly to any shareholder upon written or oral request to Kroger’s Secretary at Kroger’sour executive offices, that they intend to propose the following resolution at the annual meeting:
“The Kroger Company
Human Rights Risk Assessment- 2014Assessment - 2016
“RESOLVED, that shareholders of The Kroger CompanyCo. (“Kroger”) urge the Board of Directors to report to shareholders, at reasonable cost and omitting proprietary information, on Kroger’s process for identifying and analyzing potential and actual human rights risks of Kroger’s operations and supply chain (referred to herein as a “human rights risk assessment”) addressing the following:
| ● | Human rights principles used to frame the assessment |
| ● | Frequency of assessment |
| ● | Methodology used to track and measure performance |
| ● | Nature and extent of consultation with relevant stakeholders in connection with the assessment |
| ● | How the results of the assessment are incorporated into company policies and decision making. |
56
The report should be made available to shareholders on Kroger’s website no later than October 31, 2014.2016.
Supporting Statement
As long-term shareholders, we favor policies and practices that protect and enhance the value of our investments. There is increasing recognition that company risks related to human rights violations, such as litigation, reputational damage, and project delays and disruptions, can adversely affect shareholder value.
Kroger, like many other companies, has adopted a supplier code of conduct (See The Kroger Company Standard Vendor Agreement) but has yet to publish a company-wide Human Rights Policy, addressing human rights issues and a separate human rights code that applies to its suppliers. Adoption of these principles would be an important first step in effectively managing human rights risks. Companies must then assess risks to shareholder value of human rights practices in their operations and supply chains to translate principles into protective practices.
The importance of human rights risk assessment is reflected in the United Nations Guiding Principles on Business and Human Rights (the “Ruggie Principles”) approved by the UN Human Rights Council in 2011. The Ruggie Principles urge that “business enterprises should carry out human rights due diligence…accessingdiligence... assessing actual and potential human rights impacts, integrating and acting upon the findings, tracking responses, and communicating how impacts are addressed.” (http://www.business-humanrights.org/media/documents/ruggie/ruggie-guiding-principles-21-mar-201l.pd:Druggie-guiding-principles-21-mar-2011.pdf)
Kroger’s business exposes it to significant human rights risks. As of year-end 2012,2014, Kroger operations, including supermarkets, convenience and jewelry stores, are located in over 40 states,states. While over 90% of Kroger’s business is food its vendor Code of Conduct is based heavily on compliance with suppliers in countries around the world, including Iran, Chinalaw, and Malaysia.U.S. agricultural workers are excluded from many labor laws that apply to other U.S. workers. The company’s supply chain is complex and global. The company acknowledges that work stoppages,global and violations of human rights in Kroger’s supply chain interruptionscan lead to negative publicity, public protests, and civil unrest (The Kroger Company Form 10-K, Feb. 2, 2013, pages 32, 34) could adversely affect the company’s ability to execute its strategic plan.a loss of consumer confidence that can have a negative impact on shareholder value.
We urge shareholders to vote for this proposal.”
57
The Board of Directors Recommends a VoteAgainst This Proposal for the Following Reasons:
KrogerLike the proponents, the Board also recognizes the importance of ensuring basic human rights are recognized bythat those seeking to do business with us. As such, Kroger hasus respect basic human rights. However, the Board opposes this proposal because we are already working to ensure an ethical supply chain for the products sold in placeour stores and we have a comprehensive code of conduct that is applicable to those that furnish goods or services to us, as well as their contractors. That code of conduct has been published and is available on our website at www.kroger.com. Our existing code of conduct requires compliance with all applicable labor laws, regulations, and orders, including the Fair Labor Standards Act. In addition, the code of conduct:
57
Kroger’s code of conduct does more than simply reporting on human rights risks in its supply chain; it prohibits those that do business with us from engaging in the type of conduct of concernviolations. Furthermore, we regularly consider our policies and practices and we have recently taken several important steps to the proponents. Those that violate our code will not be permitted to do business with us until they comply with our code. As such, we do not believe that human rights violations indrive into our supply chain posegreater responsibility and accountability:
| ● | In 2015, after consultation with a number of stakeholders, we updated our Vendor Code of Conduct(the “Code of Conduct”), which is available at www.thekrogerco.com. The new Code of Conductmakes it clear that our suppliers and their suppliers are expected to live up to our standards as setforth in the Code of Conduct. To the extent they do not live up to such standards, we will not dobusiness with them. |
| ● | In 2015, we created a social responsibility center of excellence (the “Center of Excellence”) toschedule, review and monitor social responsibility audits, assess risks such as those describedabove and develop a reporting structure that informs our business decisions. The Center ofExcellence is also tasked with recommending ways to continually improve social accountability inour supply chain. |
| ● | In 2015, our annual sustainability report included a more in-depth report on our social responsibilityactivities, which is available at sustainability.kroger.com. |
| ● | Since 2012, we have more than doubled the number of social responsibility audits we haveconducted and we expect this program to continue to grow. |
| ○ | This past year, our work revealed several facility failures. Many of these facilities have significantly improved through corrective action plans, but we are no longer doing business with a few. |
| ● | In 2016, we made the Kroger Social Responsibility Audit Checklist (the “Audit Checklist”) availableonline. The Audit Checklist is required for Kroger suppliers that our social responsibility teamidentifies as higher risk due to variables such as country, product and/or industry. |
| ○ | In commodities and/or regions that are higher risk, like farmed shrimp in Thailand, we not only request supplier audits but also work with third party environmental and social certification programs to further eliminate risk in the supply chain. |
| ● | In 2016, Kroger will also conduct a third party review of commodities in our supply chain to furtherassess both environmental and social risks. |
We expect our program to continue to evolve and develop based on input from suppliers, customers, government, non-governmental organizations and developments within the industry. We believe that these efforts represent significant and positive steps forward for our Company’s social responsibility program.
Kroger is already actively implementing, monitoring, and continually improving our policies and practices, addressing a substantial risk,number of the areas discussed by the proponent. We believe that the requestedpreparation of an additional report would serve little benefitnot be an efficient use of our shareholders’ resources. We urge you to shareholders, and preparation of a report would divert resources that otherwise could be more appropriately used in the best interests of shareholders.
voteAGAINST This proposal covers the same subject matter as one submitted to a vote at the last three years’ annual meetings and was soundly defeated by shareholders.this proposal.
Shareholder Proposal(Item No. 6)5 Shareholder Proposal
We have been notified by two shareholders,one shareholder, the name and shareholdings of which will be furnished promptly to any shareholder upon written or oral request to Kroger’s Secretary at Kroger’sour executive offices, that it intends to propose the following resolution at the annual meeting:
“WHEREAS, post-consumer packaging and printed paper comprises nearly half58
Shareholder Proposal
Recyclability of U.S. landfill waste and is a significant consumerPackaging
“WHEREAS: A portion of natural resources, energy and source of greenhouse gas emissions. Half of printed paper andKroger house brand product packaging is landfilledunrecyclable, including plastics, which are a growing component of marine litter. Authorities say that marine litter kills and injures marine life, spreads toxics, and poses a potential threat to human health.
Plastic is the fastest growing form of packaging; U.S. flexible plastic sales are estimated at $26 billion. Dried fruit, frozen meat, cheese, and dog food are some of the Kroger house brand items packaged in unrecyclable plastic pouches. Private label items account for a quarter of all sales - nearly $20 billion annually. Using unrecyclable packaging when recyclable alternatives are available wastes valuable resources. William McDonough, a leading green design advisor, calls pouch packaging a “monstrous hybrid” designed to end up either in a landfill or burned rather than recycled. Plasticincinerator.
Recyclability of household packaging debris migrates to oceans where it damages fisheries, tourism and marine life. There is a growing linkarea of focus as consumers become more environmentally conscious, yet recycling rates stagnate. Only 14% of plastic packaging is recycled, according to the U.S. Environmental Protection Agency (EPA). Billions of pouches and similar plastic laminates, representing significant embedded value, lie buried in landfills. Unrecyclable packaging is more likely to be littered and swept into waterways. A recent assessment of marine debris by a panel of the Global Environment Facility concluded that one cause of debris entering oceans is “design and marketing of products internationally without appropriate regard to their environmental fate or ability to be recycled...”
In the marine environment, plastics break down into indigestible particles that marine life mistake for food. Studies by the EPA suggest a synergistic effect between ineffective waste management and plastic debris piling up in Earth’s oceans and waterways, where it ·injurespersistent, bio-accumulative, toxic chemicals. Plastics absorb toxics such as polychlorinated biphenyls and killsdioxins from water or sediment and transfer them to the marine animals, transports invasive speciesfood web and poses a threatpotentially to human health. diets. One study of fish from the North Pacific found one or more plastic chemicals in all fish tested, independent of location and species.
California spends nearly $500 million annually to preventpreventing trash, much of it packaging, from polluting beaches, rivers and oceanfront. Making all packaging recyclable, if possible, is the first step needed to reduce the threat posed by ocean frontage.debris.
The estimated market valueCompanies who aspire to corporate sustainability yet use these risky materials need to explain why they use unrecyclable packaging. Other companies who manufacture and sell food and household goods are moving towards recyclability. Procter & Gamble and Colgate-Palmolive agreed to make most of wastedtheir packaging that couldrecyclable by 2020. Keurig Green Mountain will make K-cup coffee pods recyclable; and McDonald’s and Dunkin Donuts shifted away from foam plastic cups, which cannot be recycled is $11.4 billion. Increased recycling provides more efficient use of valuable resources. It generates less pollution, and requires less energy than using virgin raw materials. In the U.S., taxpayers pay to recycle packaging, but poor infrastructure and strapped municipal budgets have yielded lagging recycling rates: 38% for aluminum; 34% for glass, and only 12% for plastic. Further, Kroger’s house brands, among other products, are recentlyincreasinguse of non-recyclable flexible plastic packaging, such as pouches.readily recycled.
More than 40 countries have shifted some or all costs of packaging recycling onto producers. U.S. producers of packaging-intensive brands can expect to be asked to take more responsibility for recycling of packaging in the future. We believe some measure of responsibility for packaging is a key component of a corporate environmental sustainability policy.
Extended Producer Responsibility (EPR), a corporate and public policy that shifts accountability for financing recycling of materials from taxpayers to producers, is a promising potential solution. Two major brands, Coca-Cola Co. and Nestle Waters NA, have called for producers to adopt EPR programs in the U.S. Legislation is pending in several states. Taking an active role in planning for mandated producer responsibility for packaging will reduce risk, ensure continued high quality packaging, reduce wasted resources, and increase program efficiencies. The company has not moved decisively to lead or participate in such an effort nor addressed its responsibility for post-consumer packaging for its brands.
BE IT RESOLVED THAT shareownersRESOLVED: Shareowners of Kroger request that the board of directors issue a report, at reasonable cost, and omitting confidential information, developing a policy position onassessing the company’s responsibility for post-consumer product packaging recyclingenvironmental impacts of its private label brands, and assessing whether alternative approaches could leadcontinuing to substantially increased packaging recycling.use unrecyclable brand packaging.
58
Supporting Statement: Options reviewed in Proponents believe that the report should include analysesan assessment of company-based actions that will increase recyclability ofthe reputational, financial and operational risks associated with continuing to use unrecyclable brand packaging materials, and, participation in policyif possible, goals and technical development of EPR or other producer responsibility strategies in collaboration with sector peers, policymakers and suppliers with a goal of greatly increased U.S. recycling rates and reduced energy use and pollution.timeline to phase out unrecyclable packaging.”
The Board of Directors Recommends Aa VoteAgainst This Proposal for the Following Reasons:
Kroger shares the proponent’s concerns regarding waste reductionplastic recyclability and recognizes the important role it playswe play as a good steward of the environment.
We continue to improve the recyclability of our Corporate Brand products, while still preserving their safety and quality. More specifically, we follow a balanced, multi-pronged approach to optimizing packaging design that considers factors such as food safety, shelf life, availability, quality, material type, function, recyclability and cost, among others.
We are increasingly labeling recyclable Corporate Brand products per the Federal Trade Commission’s Green Guides, prompting our customers to “PLEASE RECYCLE.” One example is through our redesign of Kroger brand milks, creams and orange juices that come in quart, pint and
59
half-pint packages. The packaging for these products is comprised of a bottle made from #1 polyethylene terephthalate (PETE), one of the most widely recycled plastics available, and a shrink sleeve. While the shrink sleeve is also made from #1 PETE, these shrink sleeves may interfere with the ability of the bottles to be segregated and recycled when a recycling facility uses optical scanning technology. As a result, in order to increase the number of Corporate Brand #1 PETE bottles that can be properly recycled, we have numerous sustainability initiatives in placeadded a tear perforation and the consumer message, “REMOVE LABEL TO RECYCLE BOTTLE,” to preserve our natural resourcesthe shrink labels.
We recognize that creating lasting sustainable consumption patterns requires a comprehensive approach and so we also work with various industry experts and forums to conserve energy. For instance, the company recycled more than 35 million poundsadvocate for expanded recycling infrastructure to support both multiple forms of plastic waste,packaging and diversion from landfills.
Additionally, our banner brand bread bags are made from low-density polyethylene (LDPE). This type of plastic can be a contaminant in many single stream recycling programs. To help our customers recycle their LDPE bread bags we have added customer communication on the bag that reads, “Please recycle at your local, Kroger Family of Stores drop-off location.” These drop-off recycling bins are part of our plastic bag recycling program and are typically located in the front vestibule of our stores. Along with bread bags, customers can also recycle clean and dry plastic bags, bottled water case wraps, bathroom tissue and diaper plastic overwraps, dry cleaning bags, and plastic film,newspaper bags. This program is currently undergoing rebranding and expansion to encourage customers to recycle even more in 2013. The company also recycles more than a billion pounds of cardboard each year. Most importantly, we’ve pioneered the Perishable Donations Partnership, which enables the donation of more than 49 million pounds of safe, wholesome food to Feeding America food banks to fight hunger in local communities. That which cannot be donated is composted or converted to energy through an innovative waste to energy system. By scaling up these innovative solutions, Kroger is reducing the amount of waste being sent to landfills. Kroger also works to reduce waste in the first place by designing optimized packaging,2016 and is participating in national efforts to expand and scale infrastructure. beyond.
For each of the past several years we have published on-lineThe Kroger Co. Public Responsibilities Reportandonline our annualSustainability Report that highlight the company’shighlights our sustainability initiatives and waste reduction efforts in greater detail, available at sustainability.kroger.com. In that report, we set forth a rigorous and tangible goal to strive to have zero waste in our retail locations. Through this initiative, and others, we will continue to support efforts to reduce waste, find optimized solutions and advocate for expanded recycling infrastructure as we believe these efforts are significant and meaningful. We urge you to support these efforts and voteAGAINST this proposal.
Item No. 6 Shareholder Proposal
We have been notified by two shareholders, the names and shareholdings of which will be furnished promptly to any shareholder upon written or oral request to Kroger’s Secretary at our executive offices, that they intend to propose the following resolution at the annual meeting:
Shareholder Proposal
Renewable Energy
“Whereas:
To mitigate the worst impacts of climate change, the United Nations has stated that global warming must not increase more than 2 degrees Celsius beyond pre-industrial levels, which implies U.S. carbon dioxide emission reductions of 80% from 1990 levels by 2050. (IPCC 2013). At the 2015 United Nations Conference of Parties in Paris, 195 parties agreed on a pathway to achieve a 2 degree limit.
At $108 billion in sales, Kroger is the 6th largest global retailer, and is 20th on Fortune’s 2015 Fortune 500 list (Kroger 10k; Deloitte, 2015; Fortune). Kroger’s globally significant carbon emissions - which exceed 29 nations’ respective carbon emissions from energy - are not being adequately addressed. (Kroger, “Energy/Carbon” website; IEA, Energy Atlas). Kroger lacks climate targets, and where many companies are reducing carbon, Kroger’s 2014 Scope 1 emissions increased from the previous year. Despite its significant carbon footprint, Kroger has installed renewable energy at only 8 of its 3,806 stores, plants, and distribution centers, approximately 0.2% of its locations. (Kroger “Energy/Carbon” website, Factbook).
In contrast, Whole Foods Market offsets its entire power use with renewable energy credits, and Walmart is at 24% renewable power. (Whole Foods, “Green Mission”; Walmart, “Walmart’s Approach to Renewable Energy”). Indeed, Whole Foods Market, Walmart, Whole Foods Market, and other food companies including Coca-Cola Enterprises, Mars, Nestle, and Starbucks have committed to working towards 100% renewable energy. (RE100).
60
Investing in carbon reduction can benefit Kroger’s shareholder value. Carbon reduction activities can be lucrative, yielding returns over 30%. (“Lower emissions, higher ROI”, Carbon Disclosure Project, 2014). Research indicates that corporate management of climate impacts can lead to improved financial performance, including enhanced return on equity, stronger dividends, lower earnings volatility, and minimized regulatory risk. (“S&P 500 Leaders Report”, Carbon Disclosure Project, 2014)
According to Eric Schmidt, Executive Chairman of Google (another RE100 signatory): “Much of corporate America is buying renewable energy [...] not just to be sustainable, because it makes business sense, helping companies diversify their power supply, hedge against fuel risks, and support innovation in an increasingly cost-competitive way.” (“Google’s commitment to sustainability”, Google Green Blog, 2014).
Resolved:
Shareholders request that Kroger produce a report, by year end 2016, assessing the climate benefits and feasibility of adopting enterprise-wide, quantitative, time bound targets for increasing Kroger’s renewable energy sourcing. The report should be produced at reasonable cost and exclude proprietary information.
Supporting:Shareholders request that the report include an analysis of options and scenarios for achieving renewable energy targets, for example by using on-site distributed energy, off-site generation, power purchases, and renewable energy credits, or other opportunities management would like to consider, at its discretion.”
The Board of Directors Recommends a VoteAgainst This Proposal for the Following Reasons:
Kroger shares the proponents’ concerns regarding renewable energy sourcing. We are committed to environmental sustainability and we strive to reduce our impact on the environment by using natural resources responsibly and minimizing waste in all of our operations.
Our aggressive work in energy management resulted in a reduction of overall energy consumption in our stores saving more than 2.5 billion kWh since 2000. This is the carbon equivalent of taking 362,922 cars off the road for one year.
We are actively working to do more in both the short- and long-term. For example, our Turkey Hill Dairy has two wind energy turbines with 3.2 megawatt capacity. Since 2011, these turbines have supplied up to 25% of the dairy’s annual electricity needs, which is enough power to produce six million gallons of ice cream and 15 million gallons of iced tea. In addition, ten Kroger stores have approximately 3,092kW of solar energy capacity that in 2015 produced approximately 3.94 million kWh.
The Kroger Recovery System, located in Compton, CA at the Ralphs/Food 4 Less distribution center has been in operation since late 2012. It utilizes anaerobic digestion, a naturally occurring process, to transform food waste into renewable biogas. This system annually processes approximately 45,000 tons of food waste. This biogas is then turned into power for onsite operations. The system provided approximately 3.5 million kWh of renewable energy for the 650,000 square foot Ralphs/Food 4 Less distribution center. The system reduces area truck trips by more than 500,000 miles each year and reduces waste costs. These efforts are estimated to reduce carbon emissions by 90,000 tons per year.
For each of the past several years, we have published online our annual Sustainability Report that highlights our sustainability initiatives and waste reduction efforts in greater detail. We will continue to support efforts to increase our renewable energy sourcing as we believe these efforts are significant and meaningful. You can view our Sustainability Report atsustainability.kroger.com where we address a number of the requests made by the proponent including quantitative enterprise-wide renewable energy production metrics, and supply-chain management through our logistics initiative.
We remain committed to environmental sustainability and renewable energy sourcing and we will continue to publish reports to our shareholders tracking our initiatives. We urge you to support the furthering of our current programs and vote AGAINST this proposal.
61
Item No. 7 Shareholder Proposal
We have been notified by one shareholder, the name and shareholdings of which will be furnished promptly to any shareholder upon written or oral request to Kroger’s Secretary at our executive offices, that it intends to propose the following resolution at the annual meeting:
Shareholder Proposal
Share Repurchase vs. Dividend
“Resolved: Shareholders of The Kroger Co. ask the board of directors to adopt and issue a general payout policy that gives preference to share repurchases (relative to cash dividends) as a method to return capital to shareholders. If a general payout policy currently exists, we ask that it be amended appropriately.
Supporting statement: Share repurchases as a method to return capital to shareholders have distinct advantages relative to dividends. Share repurchases should be preferred for the following reasons:
| 1) | Financial flexibility. Four professors from Duke University and Cornell University studied executives’ decisions to pay dividends or make repurchases by surveying hundreds of executives of public companies. They found that “maintaining the dividend level is on par with investment decisions, while repurchases are made out of the residual cash flow after investment spending.”1Further, in follow up interviews as part of the study, executives “state[d] that they would pass up some positive net present value (NPV) investment projects before cutting dividends.” The creation of long-term value is of paramount importance; I believe that repurchases have the distinct advantage that they do not create an incentive to forgo long-term value enhancing projects in order to preserve a historic dividend level. | ||
| 2) | Tax efficiency. Share repurchases have been described in the Wall Street Journal2as “akin to dividends, but without the tax bite for shareholders.” The distribution of a dividend may automatically trigger a tax liability for some shareholders. The repurchase of shares does not necessarily trigger that automatic tax liability and therefore gives a shareholder the flexibility to choose when the tax liability is incurred. Shareholders who desire cash flow can choose to sell shares and pay taxes as appropriate. (This proposal does not constitute tax advice.) | ||
| 3) | Market acceptance: Some may believe that slowing the growth rate or reducing the level of dividends would result in a negative stock market reaction. However, a study published in the Journal of Finance finds that the market response to cutting dividends by companies that were also share repurchasers was not statistically distinguishable from zero.3I believe this study provides evidence that there is market acceptance that repurchases are valid substitutes for dividends. | ||
Some may worry that share repurchases could be used to prop up metrics that factor into the compensation of executives. I believe that any such concern should not interfere with the choice of optimal payout mechanism because compensation packages can be designed such that metrics are adjusted to account for share repurchases.
| 1 | http://www. sciencedirect.com/science/article/pii/S0304405XO5000528 | ||
| 2 | http://www.wsj.com/articles/companies-stock-buybacks-help-buoy-the-market-1410823441 | ||
| 3 | http://www.afajof.org/details/journalArticle/2893861/Dividends-Share-Repurchases-and-the- Substitution-Hypothesis.html | ||
62
The Board of Directors Recommends a VoteAgainst This Proposal for the Following Reasons:
Kroger believes that the policy advocated by the shareholder proposal is not in the best interests of our shareholders as it reduces long-term flexibility in the allocation of capital. In a rapidly evolving capital market, this flexibility is an essential element in the careful management of shareholder capital, which the Board thoughtfully oversees and reviews on a regular basis.
Our long-term financial strategy continues to be to use cash flow from operations, in a balanced manner, to repurchase shares, fund dividends, and increase capital investments, all while maintaining our current investment grade debt rating. Our balanced approach gives us the flexibility to pursue long-term growth strategies while returning capital to our shareholders.
Kroger is proud of our strong history of capital return to shareholders. We have made significant commitments over time to return capital to shareholders both through repurchases of our common shares and payment of cash dividends. We repurchased $703 million of Kroger common shares in 2015, as well as $1.1 billion in 2014, $338 million in 2013 and $1.2 billion in 2012. Additionally, we paid dividends totaling $385 million in 2015, $338 million in 2014, $319 million in 2013 and $267 million in 2012. We are also committed to growing long-term shareholder value through significant capital investments. Excluding acquisitions, we invested $3.38 billion, $2.89 billion, $2.46 billion and $2.06 billion in capital projects in 2015, 2014, 2013, and 2012, respectively. Many of our shareholders view both dividends and share repurchases as an important component of Kroger’s investment profile, especially in light of our balanced capital return strategy that contributes to a healthy TSR (total shareholder return), which outperforms both our peers and the S&P 500 over time.
When contemplating capital returns, the Board engages in a thorough analysis and oversight process. Before the Board approves any share repurchase program or declares a cash dividend, it takes into account a wide range of factors, including Kroger’s short and long-term growth strategies, liquidity needs and capital requirements, cash flows, net earnings, debt obligations, and leverage ratios. The Board also considers how the then-current capital market conditions affect Kroger’s policies and strategies. There is no one-size-fits-all policy or strategy in returning capital to shareholders that would satisfy each market condition over the course of time. Balanced capital allocation decisions, overseen by an effective Board, remain the most effective and flexible strategy to continuously deliver healthy value to shareholders over the long-term.
This proposal requests that Kroger take additional steps to report on the feasibility of adoptingadopt a policy of “Extended Producer Responsibility,” or EPR. The resolution provides no guidance regarding proponent’s view of the requirements of a company-adopted EPR policy.
Kroger supports efforts to reduce waste in the supply chain, as described above and in our various sustainability reports. It would be inappropriate, however, to support ageneral policy that is not clearly defined.gives preference to share repurchases relative to cash dividends. We believe our support for waste reduction efforts in our supply chain are significanturge you to voteAGAINST this proposal.
63
Shareholder Proposals and meaningful.Director Nominations – 2017 Annual Meeting
Kroger is familiar with various EPR proposals in states and laws in other countries that require retailers and manufacturers to pay substantial taxes and fees related to waste disposal. The proposals vary in detail and implementation, and while we do assess new laws and regulations for their feasibility, cost and requirements, to do so for each individual EPR proposal at the federal, state, and international level would require significant resources that could be allocated more wisely in the best interests of shareholders.
Kroger often is asked to take a position on legislation or regulatory proposals. While occasionally we will communicate to federal, state and local officials our positions on specific policy issues, we believe it is premature to offer an official position statement on EPR legislative and regulatory proposals without first carefully examining the specifics of each individual law or regulation and how it would affect our customers and our business.
This proposal covers the same subject matter as one submitted to a vote at the last two years’ annual meetings and was soundly defeated by shareholders.
____________________
SHAREHOLDER PROPOSALS – 2015 ANNUAL MEETING. Shareholder proposals intended for inclusion in ourthe proxy material relating to Kroger’s annual meeting of shareholders in June 20152017 should be addressed to theKroger’s Secretary of Kroger and must be received at our executive offices not later than January 14, 2015.12, 2017. These proposals must comply with Rule 14a-8 and the SEC’s proxy rules. The Company’s
In addition, Kroger’s Regulations contain an advance notice of shareholder business and director nominations requirement, which generally prescribes the procedures that a shareholder of the CompanyKroger must follow if the shareholder intends, at an annual meeting, to nominate a person for election to the Company’sKroger’s Board of Directors or to propose other business to be considered by shareholders. These procedures include, among other things, that the shareholder give timely notice to theKroger’s Secretary of the Company of the nomination or other proposed business, that the notice contain specified information, and that the shareholder comply with certain other requirements. Generally, in the case of an
59
annual meeting, a shareholder’s notice inIn order to be timely, this notice must be delivered in writing to theKroger’s Secretary, of the Company, at itsour principal executive office,offices, not later 45 calendar days prior to the date on which the Company’sour proxy statement for the prior year’s annual meeting of shareholders was mailed to shareholders. If a shareholder’s nomination or proposal is not in compliance with the procedures set forth in the Regulations, the Companywe may disregard such nomination or proposal. Accordingly, if a shareholder intends, at the 20152017 annual meeting, to nominate a person for election to the Board of Directors or to propose other business, the shareholder must deliver a notice of such nomination or proposal to the Company’sKroger’s Secretary not later March 30, 2015,28, 2017, and comply with the requirements of the Regulations. If a shareholder submits a proposal outside of Rule 14a-8 for the Company’s 20152017 annual meeting of shareholder and such proposal is not delivered within the time frame specified in the Regulations, the Company’sKroger’s proxy may confer discretionary authority on persons being appointed as proxies on behalf of the CompanyKroger to vote on such proposal. NoticesShareholder proposals, director nominations and advance notices should be addressed in writing to: Secretary, The Kroger Co., 1014 Vine Street, Cincinnati, Ohio 45202-1100.
____________________2015 Annual Report
Attached to this Proxy Statement is Kroger’s 2013our 2015 Annual Report which includes a brief description of Kroger’sour business, including the general scope and nature thereof during 2013,fiscal year 2015, together with the audited financial information contained in our 2013 report to the SEC2015 Annual Report on Form 10-K.10-K filed with the SEC.A copy of that report is available to shareholders on request without charge by writing to: Todd A. Foley, Treasurer, The Kroger Co., 1014 Vine Street, Cincinnati, Ohio 45202-1100 or by calling 1-513-762-1220513-762-1220. Our SEC filings are available to the public fromon the SEC’s web sitewebsite at www.sec.gov.
Householding of Proxy Materials
We have adopted a procedure approved by the SEC called “householding.” Under this procedure, shareholders of record who have the same address and last name will receive only one copy of the Notice of Internet Availability of Proxy Materials (or proxy materials in the case of shareholders who receive paper copies of such materials) unless one or more of these shareholders notifies us that they wish to continue receiving individual copies. This procedure will reduce our printing costs and postage fees. Householding will not in any way affect dividend check mailings.
If you are eligible for householding, but you and other shareholders of record with whom you share an address currently receive multiple copies of our Notice of Internet Availability of Proxy Materials (or proxy materials in the case of shareholders who receive paper copies of such materials), or if you hold in more than one account, and in either case you wish to receive only a single copy for your household or if you prefer to receive separate copies of our documents in the future, please contact your bank or broker, or contact Kroger’s Secretary at 1014 Vine Street, Cincinnati, Ohio 45202-1100 or via telephone at 513-762-4000.
The management knows of no other matters that are to be presented at the meeting, but, if any should be presented, the Proxy Committee expects to vote thereon according to its best judgment.
By order of the Board of Directors, | |
|
60
APPENDIX 1
THE KROGER CO.2014 LONG-TERM INCENTIVE AND CASH BONUS PLAN
1. Definitions
In this Plan the following definitions will apply:
1.1 “Agreement” means a written instrument implementing a grant of an Option, Right or Performance Unit, an award of Restricted Stock or Incentive Shares, or setting forth the terms of a Cash Bonus.
1.2 “Board” means the Board of Directors of the Company.
1.3 “Cash Bonus” means an annual or long-term bonus awarded to a participant under the Cash Bonus Program and determined by the Committee based on performance measured against Performance Goals established by the Committee.
1.4 “Cash Bonus Program” means that portion of the Plan under which a participant is awarded a Cash Bonus.
1.5 “Code” means the Internal Revenue Code of 1986, as amended.
1.6 “Committee” means the committee appointed to administer each of the Programs under the Plan. For purposes of the Insider Program and the Cash Bonus Program the Committee will be a committee of the Board meeting the standards of Rule 16b-3(d)(1) under the Exchange Act, or any similar successor rule, appointed by the Board to administer the Insider Program and the Cash Bonus Program, which initially will be composed of those members of the Compensation Committee of the Board who qualify as “outside directors” under Section 162(m) of the Code. For purposes of the Non-Insider Program, the Committee will be the Stock Option Committee.
1.7 “Company” means THE KROGER CO.
1.8 “Date of Exercise” means the date on which the Company receives notice of the exercise of an Option, Right or Performance Unit in accordance with the terms of Article 9.
1.9 “Date of Grant” means the date on which an Option, Right or Performance Unit is granted or Restricted Stock or Incentive Shares are awarded by the Committee.
1.10 “Director” means a non-Employee member of the Board of the Company.
1.11 “Employee” means any person, excluding Directors, to whom awards or grants can be made pursuant to the securities laws of the United State and to whom such awards or grants are made by the Committee.
1.12 “Exchange Act” means the Securities Exchange Act of 1934, as amended.
1.13 “Fair Market Value” of a Share means the amount equal to the fair market value of a Share determined pursuant to a reasonable method adopted by the Committee in good faith for such purpose. Unless otherwise provided in an Agreement to the contrary, the Fair Market Value of a Share will be the closing price on the date of determination on the New York Stock Exchange--Composite Transactions, or if no sales are made on such date, on the most recent prior date for which sales are reported.
1.14 “Grantee” means an Employee or a Director to whom Restricted Stock has been awarded pursuant to Article 11 or to whom Incentive Shares have been awarded pursuant to Article 12.
1.15 “Incentive Share” means a Share awarded pursuant to Article 12.
1.16 “Insider” means an officer of the Company subject to Section 16(a) of the Exchange Act.
1.17 “Insider Program” means that portion of the Plan under which grants or awards are made to Insiders and Directors.
61
1.18 “Non-Insider Program” means that portion of the Plan under which grants or awards are made to Employees, excluding Insiders.
1.19 “Option” means a nonstatutory stock option granted under the Plan that does not qualify as an incentive stock option under Section 422 of the Code.
1.20 “Option Period” means the period during which an Option may be exercised.
1.21 “Option Price” means the price per Share at which an Option may be exercised. The Option Price will be determined by the Committee, but in no event will the Option Price of an Option be less than the Fair Market Value per Share determined as of the Date of Grant.
1.22 “Optionee” means an Employee or Director to whom an Option, Right or Performance Unit has been granted.
1.23 “Performance Goals” means performance goals established by the Committee that may be based on: (i) earnings or earnings per share of Kroger, a unit of Kroger, or designated projects; (ii) total sales, identical sales, or comparable sales of Kroger, a unit of Kroger, or designated projects; (iii) cash flow; (iv) cash flow from operations; (v) operating profit or income; (vi) net income; (vii) operating margin; (viii) net income margin; (ix) return on net assets; (x) economic value added; (xi) return on total assets; (xii) return on common equity; (xiii) return on total or invested capital; (xiv) total shareholder return; (xv) revenue; (xvi) revenue growth; (xvii) earnings before interest, taxes, depreciation and amortization (“EBITDA”); (xviii) EBITDA growth; (xix) funds from operations per share and per share growth; (xx) cash available for distribution; (xxi) cash available for distribution per share and per share growth; (xxii) share price performance on an absolute basis and relative to an index of earnings per share or improvements in Kroger’s attainment of expense levels; (xxiii) reduction in operating costs as a percentage of sales; (xxiv) performance in key categories; (xxv) implementing or completion of strategic initiatives or critical projects, and (xxvi) key category performance as measured by the results of surveys of customers or associates; or any other objective goals established by the Committee, and may be absolute in their terms or measured against or in relationship to other companies similarly or otherwise situated. Performance goals may be particular to an employee or the department, branch, Subsidiary or other division in which he or she works, or may be based on the performance of the Company generally, and may cover such period as may be specified by the Committee.
1.24 “Performance Unit” means a performance unit granted under the Plan in accordance with Article 8.
1.25 “Performance Unit Period” means the period during which a Performance Unit is outstanding.
1.26 “Plan” means THE KROGER CO. 2014 Long-Term Incentive and Cash Bonus Plan.
1.27 “Related Option” means the Option in connection with which a specified Right or Performance Unit is granted.
1.28 “Related Performance Unit” means the Performance Unit granted in connection with a specified Option.
1.29 “Related Right” means the Right granted in connection with a specified Option.
1.30 “Restricted Stock” means Shares awarded pursuant to Article 11.
1.31 “Right” means a stock appreciation right granted under the Plan pursuant to Article 7.
1.32 “Right Period” means the period during which a Right may be exercised.
1.33 “Share” means an authorized but unissued common share, par value $1.00 per share, of the Company, or a reacquired previously issued common share.
1.34 “Stock Option Committee” means a committee of three or more members appointed by the Chief Executive Officer of the Company to administer the Non-Insider Program, each of whom is ineligible to receive grants or awards under the Non-Insider Program, and has been so ineligible for at least one year.
1.35 “Subsidiary” means a corporation at least 50% of the total combined voting power of all classes of stock of which is owned by the Company, either directly or through one or more other Subsidiaries.
62
2. Purpose
The Plan is intended to assist in attracting and retaining Employees and Directors of outstanding ability and to promote the identification of their interests with those of the shareholders of the Company.
3. Administration
The Plan will be administered by the Committee. In addition to any other powers granted to the Committee, it will have the following powers, subject to the express provisions of the Plan:
3.1 to determine in its discretion the Employees to whom Options, Performance Units or Rights will be granted, to whom Restricted Stock and Incentive Shares will be awarded, and those Employees eligible to receive Cash Bonuses; the number of Shares to be subject to each Option, Right, Performance Unit, Restricted Stock or Incentive Share award, and the terms upon which Options, Rights or Performance Units may be acquired and exercised and the terms and conditions of Restricted Stock and Incentive Share awards and Cash Bonuses;
3.2 to determine all other terms and provisions of each Agreement, which need not be identical;
3.3 without limiting the generality of the foregoing, to provide in its discretion in an Agreement:
(a) for an agreement by the Optionee or Grantee to render services to the Company or a Subsidiary upon such terms and conditions as may be specified in the Agreement, provided that the Committee will not have the power to commit the Company or any Subsidiary to employ or otherwise retain any Optionee or Grantee;
(b) for restrictions on the transfer, sale or other disposition of Shares issued to the Optionee upon the exercise of an Option, Right or Performance Unit, for other restrictions permitted by Article 11 with respect to Restricted Stock or for conditions with respect to the issuance of Incentive Shares;
(c) for an agreement by the Optionee or Grantee to resell to the Company, under specified conditions, Shares issued upon the exercise of an Option, Right or Performance Unit or awarded as Restricted Stock or Incentive Shares;
(d) for the payment of the Option Price upon the exercise by an Employee or Director of an Option otherwise than in cash, including without limitation by delivery of Common Shares (other than Restricted Stock) valued at Fair Market Value on the Date of Exercise of the Option, or a combination of cash and Shares; and
(e) for the deferral of receipt of amounts that otherwise would be distributed upon exercise of a Performance Unit, the terms and conditions of any such deferral and any interest or dividend equivalent or other payment that will accrue with respect to deferred distributions;
3.4 to construe and interpret the Agreements and the Plan;
3.5 to require, whether or not provided for in the pertinent Agreement, of any person exercising an Option, Right or Performance Unit or acquiring Restricted Stock or Incentive Shares, at the time of such exercise or acquisition, the making of any representations or agreements that the Committee may deem necessary or advisable in order to comply with the securities laws of the United States or of any state;
3.6 to provide for satisfaction of an Optionee’s or Grantee’s tax liabilities arising in connection with the Plan through, without limitation, retention by the Company of Common Shares otherwise issuable on the exercise of an Option, Right or Performance Unit or pursuant to an award of Incentive Shares or through delivery of Common Shares to the Company by the Optionee or Grantee under such terms and conditions as the Committee deems appropriate; and
3.7 to make all other determinations and take all other actions necessary or advisable for the administration of the Plan.
Any determinations or actions made or taken by the Committee pursuant to this Article will be binding and final.
63
4. Eligibility
Options, Rights, Performance Units, Restricted Stock and Incentive Shares may be granted or awarded only to Employees and Directors. Cash Bonuses may only be awarded to Employees. In no event may any participant receive awards and grants totaling more than 3,750,000 Shares in the aggregate under this Plan, and no single Cash Bonus to a participant may exceed $5,000,000.
5. Shares Subject to the Plan
5.1 The maximum number of Shares that may be issued under the Plan is 25,000,000 Shares. Except as otherwise provided in the following sentence, the maximum number of Shares that may be issued as Restricted Stock, Incentive Shares, or Performance Units under the Plan is 10,000,000 Shares in the aggregate. Notwithstanding the foregoing, the Committee for the Insider Program may increase the number of Shares that may be issued as Restricted Stock, Incentive Shares, or Performance Units to an amount in excess of 10,000,000 Shares, provided that for each such Share in excess of 10,000,000 Shares that are issued as Restricted Stock, Incentive Shares, or Performance Units, in the aggregate, the number of Shares that may be issued under the Plan will be reduced by four Shares. In addition to the decisions that it makes in administering the Insider Program, annually the Committee for the Insider Program will approve the number of Shares to be granted under the Non-Insider Program for that fiscal year.
5.2 If an Option, Right or Performance Unit expires or terminates for any reason (other than termination by virtue of the exercise of a Related Option, Related Right or a Related Performance Unit, as the case may be) without having been fully exercised, if Shares of Restricted Stock are forfeited or if Incentive Shares are not issued or are forfeited, the unissued or forfeited Shares that had been subject to the Agreement relating thereto will become available for the grant of other Options, Rights and Performance Units or for the award of additional Restricted Stock or Incentive Shares, provided that in the case of forfeited Shares, the Grantee has received no dividends prior to forfeiture with respect to such Shares.
6. Options
6.1 The Committee is authorized to grant Options to Employees and Directors.
6.2 The Option Period for Options granted to Employees and Directors will be determined by the Committee and specifically set forth in the Agreement. No Option will be exercisable before six months after the Date of Grant (except that this limitation need not apply in the event of the death or disability of the Optionee within the six-month period) or after ten years from the Date of Grant.
6.3 The maximum number of Shares with respect to which Options may be granted to any Employee or Director under this Plan during its term is 3,750,000 Shares. In no event will the Option Price of an Option be less than the Fair Market Value of a Share at the time of the grant.
6.4 Except in connection with a corporate transaction involving the company (including, without limitation, any stock dividend, stock split, extraordinary cash dividend, recapitalization, reorganization, merger, consolidation, split-up, spin-off, combination, or exchange of shares) or as otherwise permitted pursuant to Article 13 or Article 15, the Option Price of an Option as set forth on the Date of Grant will not be reduced during the term of the Option, nor will Options be canceled in exchange for cash, other awards, or newly issued Options with an Option Price that is less than the Option Price of the original Options without shareholder approval (i.e., Options will not be “repriced”).
6.5 All other terms of Options granted under the Plan will be determined by the Committee in its sole discretion.
7. Rights
7.1 The Committee is hereby authorized to grant Rights to Employees and Directors.
7.2 A Right may be granted under the Plan:
(a) in connection with, and at the same time as, the grant of an Option under the Plan; or
(b) independently of any Option granted under the Plan.
64
A Right granted under clause (a) of the preceding sentence is a Related Right. A Related Right may, in the Committee’s discretion, apply to all or a portion of the Shares subject to the Related Option.
7.3 A Right may be exercised in whole or in part as provided in the Agreement, and, subject to the provisions of the Agreement, entitles its Optionee to receive, without any payment to the Company (other than required income tax withholding amounts), either cash or that number of Shares (equal to the highest whole number of Shares), or a combination thereof, in an amount or having a Fair Market Value determined as of the Date of Exercise not to exceed the number of Shares subject to the portion of the Right exercised multiplied by an amount equal to the excess of (i) the Fair Market Value of a Share on the Date of Exercise of the Right over (ii) either (A) the Fair Market Value of a Share on the Date of Grant of the Right if it is not a Related Right, or (B) the Option Price as provided in the Related Option if the Right is a Related Right.
7.4 The Right Period will be determined by the Committee and specifically set forth in the Agreement, provided, however --
(a) a Right may not be exercised before the expiration of six months from the Date of Grant (except that this limitation need not apply in the event of the death or disability of the Optionee within the six-month period);
(b) a Right will expire no later than the earlier of (i) ten years from the Date of Grant, or (ii) in the case of a Related Right, the expiration of the Related Option; and
(c) a Right may be exercised only when the Fair Market Value of a Share exceeds either (i) the Fair Market Value of a Share on the Date of Grant of the Right if it is not a Related Right, or (ii) the Option Price as provided in the Related Option if the Right is a Related Right.
7.5 The exercise, in whole or in part, of a Related Right will cause a reduction in the number of Shares subject to the Related Option equal to the number of Shares with respect to which the Related Right is exercised. Similarly, the exercise, in whole or in part, of a Related Option will cause a reduction in the number of Shares subject to the Related Right equal to the number of Shares with respect to which the Related Option is exercised.
7.6 Rights granted under the Plan, to the extent determined by the Committee, will comply with the requirements of Rule 16b-3 under the Exchange Act during the term of this Plan. Should any additional provisions be necessary for this Article 7 to comply with the requirements of Rule 16b-3 or any other rules or regulations, the Board may amend this Plan to delete, add to or modify the provisions of the Plan accordingly, subject to the provisions of Article 14, if applicable. The Company intends to comply, if and to the extent applicable, with the requirements of Rule 16b-3; however, the Company’s failure for any reason whatsoever to comply with such requirements will not impose any liability on the Company to any Optionee or any other party.
7.7 To the extent required by Rule 16b-3 under the Exchange Act or otherwise provided in the Agreement, the Committee will have sole discretion to consent to or disapprove the election of any Optionee to receive cash in full or partial settlement of a Right. In cases where an election of settlement in cash must be consented to by the Committee, the Committee may consent to, or disapprove, such election at any time after such election, or within such period for taking action as is specified in the election, and failure to give consent will be disapproval. Consent may be given in whole or as to a portion of the Right surrendered by the Optionee. If the election to receive cash is disapproved in whole or in part, the Right will be deemed to have been exercised for Shares, or, if so specified in the notice of exercise and election, not to have been exercised to the extent the election to receive cash is disapproved.
7.8 The maximum number of Shares with respect to which Rights may be granted to any Employee or Director under this Plan during its term is 3,750,000 Shares.
7.9 Except in connection with a corporate transaction involving the company (including, without limitation, any stock dividend, stock split, extraordinary cash dividend, recapitalization, reorganization, merger, consolidation, split-up, spin-off, combination, or exchange of shares) or as otherwise permitted pursuant to Article 13 or Article 15, the exercise price of a Right as set forth on the Date of Grant will not
65_____________
2015 ANNUAL REPORT
be reduced during the term of the Right, nor will Rights be canceled in exchange for cash, other awards, or newly issued Rights with an exercise price that is less than the exercise price of the original Rights without shareholder approval (i.e., Rights will not be “repriced”).
8. Performance Units
_____________
8.1 The Committee is hereby authorized to grant Performance Units to Employees and Directors.
8.2 Performance Units may be granted under the Plan:
(a) in connection with, and at the same time as, the grant of an Option under the Plan; or
(b) independently of any Option granted under the Plan.
A Performance Unit granted under clause (a) of the preceding sentence is a Related Performance Unit. A Related Performance Unit may, in the Committee’s discretion, apply to all or a portion of the shares subject to the Related Option.
8.3 A Performance Unit may be exercised in whole or in part, or automatically may be deemed exercised upon satisfaction of the Performance Goals, as provided in the Agreement, and, subject to the provisions of the Agreement, entitles its Optionee to receive, without any payment to the Company (other than required income tax withholding amounts), cash, Shares or a combination of cash and Shares, based upon the degree to which Performance Goals established by the Committee and specified in the Agreement have been achieved.
8.4 The Performance Unit Period will be determined by the Committee and specifically set forth in the Agreement, provided, however --
(a) a Performance Unit may not be exercised before the expiration of six months from the Date of Grant (except that this limitation need not apply in the event of the death or disability of the Optionee within the six-month period); and
(b) a Performance Unit will expire no later than the earlier of (i) ten years from the Date of Grant, or (ii) in the case of a Related Performance Unit, the expiration of the Related Option.
8.5 Each Agreement granting Performance Units will specify the number of Performance Units granted; provided, however, that the maximum number of Related Performance Units may not exceed the maximum number of Shares subject to the Related Option.
8.6 The exercise, in whole or in part, of Related Performance Units will cause a reduction in the number of Shares subject to the Related Option and the number of Performance Units in accordance with the terms of the Agreement. Similarly, the exercise, in whole or in part, of a Related Option, will cause a reduction in the number of Shares subject to the Related Performance Unit equal to the number of Shares with respect to which the Related Option is exercised.
8.7 Performance Units granted under the Plan, to the extent determined by the Committee, will comply with the requirements of Rule 16b-3 under the Exchange Act during the term of this Plan. Should any additional provisions be necessary for this Article 8 to comply with the requirements of Rule 16b-3 or any other applicable rule or regulation, the Board may amend this Plan to delete, add to or modify the provisions of the Plan accordingly, subject to the provisions of Article 14, if applicable. The Company intends to comply, if and to the extent applicable, with the requirements of Rule 16b-3; however, the Company’s failure for any reason whatsoever to comply with such requirements will not impose any liability on the Company to any Optionee or any other party.
8.8 To the extent required by Rule 16b-3 under the Exchange Act or otherwise provided in the Agreement, the Committee will have sole discretion to consent to or disapprove the election of any Optionee to receive cash in full or partial settlement of a Performance Unit. In cases where an election of settlement in cash must be consented to by the Committee, the Committee may consent to, or disapprove, such election at any time after such election, or within such period for taking action as is specified in the election, and failure to give consent will be disapproval. Consent may be given in whole or as to a portion of the Performance
66
Unit surrendered by the Optionee. If the election to receive cash is disapproved in whole or in part, the Performance Unit will be deemed to have been exercised for Shares, or, if so specified in the notice of exercise and election, not to have been exercised to the extent the election to receive cash is disapproved.
8.9 The maximum number of Shares that may be issued to any Employee or Director pursuant to the exercise of Performance Units may not exceed 3,750,000 Shares. For purposes of the preceding sentence, any Performance Units paid in the form of cash will be deemed to have been paid in Shares, with the number of Shares being deemed paid equal to the amount of cash paid to the Employee or Director divided by the Fair Market Value of a Share on the date of payment.
9. Exercise
An Option, Right or Performance Unit, subject to the provisions of the Agreement under which it was granted, may be exercised in whole or in part by the delivery to the Company of written notice of the exercise, in such form as the Committee may prescribe, accompanied, in the case of an Option, by (i) full payment for the Shares with respect to which the Option is exercised, or (ii) irrevocable instructions to a broker selected by the Committee to consummate “cashless” exercises to deliver promptly to the Company cash equal to full payment for the Shares for which the Option is exercised.
10. Non-transferability
Options, Rights, Performance Units and Incentive Shares granted or awarded under the Plan will not be transferable otherwise than by will or the laws of descent and distribution, and an Option, Right or Performance Unit may be exercised during his or her lifetime only by the Optionee or, in the event of his or her legal disability, by his or her legal representative. A Related Right or Related Performance Unit is transferable only when the Related Option is transferable and only with the Related Option and under the same conditions.
11. Restricted Stock Awards
11.1 The Committee is hereby authorized to award Shares of Restricted Stock to Employees and Directors.
11.2 Restricted Stock awards under the Plan will consist of Shares that are restricted against transfer, subject to forfeiture, and subject to such other terms and conditions intended to further the purposes of the Plan as may be determined by the Committee. The terms and conditions may provide, in the discretion of the Committee, for the vesting of such awards to be contingent upon the achievement of one or more Performance Goals.
11.3 Restricted Stock awards will be evidenced by Agreements containing provisions setting forth the terms and conditions governing such awards. Each such agreement will contain the following:
(a) prohibitions against the sale, assignment, transfer, exchange, pledge, hypothecation, or other encumbrance of (i) the Shares awarded as Restricted Stock under the Plan, (ii) the right to vote the Shares, or (iii) the right to receive dividends thereon in each case during the restriction period applicable to the Shares; provided, however, that the Grantee will have all the other rights of a shareholder including, but not limited to, the right to receive dividends and the right to vote the Shares;
(b) at least one term, condition or restriction constituting a “substantial risk of forfeiture” as defined in Section 83(c) of the Code;
(c) such other terms, conditions and restrictions as the Committee in its discretion may specify (including, without limitation, provisions creating additional substantial risks of forfeiture);
(d) a requirement that each certificate or other evidence of ownership representing Shares of Restricted Stock must be deposited with the Company, or its designee, and will bear the following legend:
“This certificate or other evidence of ownership and the shares of stock represented hereby are subject to the terms and conditions (including the risks of forfeiture and restrictions against transfer) contained in THE KROGER CO.
67
2014 Long-Term Incentive and Cash Bonus Plan and an Agreement entered into between the registered owner and The Kroger Co. Release from such terms and conditions will be made only in accordance with the provisions of the Plan and the Agreement, a copy of each of which is on file in the office of the Secretary of The Kroger Co.
(e) the applicable period or periods of any terms, conditions or restrictions applicable to the Restricted Stock, provided, however, that the Committee in its discretion may accelerate the expiration of the applicable restriction period with respect to any part or all of the Shares awarded to a Grantee; and
(f) the terms and conditions upon which any restrictions upon Shares of Restricted Stock awarded under the Plan will lapse and new certificates free of the foregoing legend will be issued to the Grantee or his or her legal representative.
11.4 The Committee may include in an Agreement a requirement that in the event of a Grantee’s termination of employment for any reason prior to the lapse of restrictions, all Shares of Restricted Stock will be forfeited by the Grantee to the Company without payment of any consideration by the Company, and neither the Grantee nor any successors, heirs, assigns or personal representatives of the Grantee will thereafter have any further rights or interest in the Shares or certificates.
11.5 The maximum number of Shares of Restricted Stock that may be awarded to any Employee or Director under this Plan during its term is 3,750,000 Shares.
12. Incentive Share Awards
12.1 The Committee is hereby authorized to award Incentive Shares to Employees and Directors.
12.2 Incentive Shares will be Shares that are issued at such times, subject to achievement of such Performance Goals or other goals, or without condition, and on such other terms and conditions as the Committee deems appropriate and specify in the Agreement relating thereto.
12.3 The maximum number of Shares of Incentive Shares that may be awarded to any Employee or Director under this Plan during its term is 3,750,000 Shares.
13. Capital Adjustments
The number and class of Shares subject to each outstanding Option, Right or Performance Unit or Restricted Stock or Incentive Share award, the Option Price and the aggregate number and class of Shares for which grants or awards thereafter may be made will be subject to such adjustment, if any, as the Committee in its sole discretion deems appropriate to reflect such events as stock dividends, stock splits, adoption of stock rights plans, recapitalizations, mergers, consolidations or reorganizations of or by the Company.
14. Termination or Amendment
The Board may amend or terminate this Plan in any respect at any time. Board approval must be accompanied by (i) shareholder approval in those cases in which amendment requires shareholder approval under applicable law or regulations or the requirements of the principal exchange or interdealer quotation system on which the Shares are listed or quoted, and (ii) affected Optionee or Grantee approval if the amendment or termination would adversely affect the holder’s rights under any outstanding grants or awards. The Cash Bonus Program may be wholly or partially amended or otherwise modified, suspended or terminated at any time or from time to time by the Committee or the Board. To the extent required by Section 162(m) of the Internal Revenue Code with respect to bonus awards that the Committee determines should qualify as performance-based compensation as described in Section 162(m)(4)(C), no action may modify the performance criteria or bonus potentials after the commencement of the measurement period with respect to which such bonus awards relate.
68
15. Modification, Extension and Renewal of Options, Rights, Performance Units, Restricted Stock and Incentive SharesFINANCIAL REPORT 2015
Subject to the terms and conditions and within the limitations of the Plan, the Committee may modify, extend or renew outstanding Options, Rights and Performance Units, or accept the surrender of outstanding options, rights and performance units (to the extent not theretofore exercised) granted under the Plan or under any other plan of the Company, a Subsidiary or a company or similar entity acquired by the Company or a Subsidiary, and authorize the granting of new Options, Rights and Performance Units pursuant to the Plan in substitution therefor (to the extent not theretofore exercised), and the substituted Options, Rights and Performance Units may specify a longer term than the surrendered options, rights and performance units or may have any other provisions that are authorized by the Plan; provided that the exercise price may not be less than that of the surrendered option, rights and performance units. Subject to the terms and conditions and within the limitations of the Plan, the Committee may modify the terms of any outstanding Agreement providing for awards of Restricted Stock or Incentive Shares. Notwithstanding the foregoing, however, no modification of an Option, Right or Performance Unit granted under the Plan, or an award of Restricted Stock or Incentive Shares, will, without the consent of the Optionee or Grantee, alter or impair any of the Optionee’s or Grantee’s rights or obligations.
16. Cash BonusesMANAGEMENT’S RESPONSIBILITY FOR FINANCIAL REPORTING
Two types of bonuses can be awarded under the Cash Bonus Program; an annual bonus award for each fiscal year, and a long-term bonus award for measurement periods in excess of one year. Bonus payments are based on the Company’s performance measured against Performance Goals established by the Committee. The Committee establishes a bonus “potential” for each bonus payable under the Cash Bonus Program for each participant, based on the participant’s level within the Company, and actual payouts can exceed that amount when the Company’s performance exceeds the pre-established thresholds. Initially the Performance Goals for annual bonuses will include the following components: (i) EBITDA; (ii) identical sales; (iii) achievement of strategic initiatives, and (iv) achievement of supermarket fuel center goals for EBITDA, gallons sold, and number of fuel centers. Initially the Performance Goals for long-term bonuses will include the following components: (i) performance in four key categories in the Company’s strategic plan, (ii) reduction in operating costs as a percentage of sales, (iii) performance in categories designed to measure associate engagement, and (iv). No single cash bonus to a participant may exceed $5,000,000.
17. Effectiveness of the Plan
The Plan and any amendments requiring shareholder approval pursuant to Article 14 are subject to approval by vote of the shareholders of the Company within 12 months after their adoption by the Board. Subject to that approval, the Plan is effective upon approval by the shareholders and any amendments are effective on the date on which they are adopted by the Board. Options, Rights, Performance Units, Restricted Stock and Incentive Shares may be granted or awarded prior to shareholder approval of the Plan or amendments, but each such Option, Right, Performance Unit, Restricted Stock or Incentive Share grant or award will be subject to the approval of the Plan or amendments by the shareholders. The date on which any Option, Right, Performance Unit, Restricted Stock or Incentive Shares granted or awarded prior to shareholder approval of the Plan or amendment is granted or awarded will be the Date of Grant for all purposes as if the Option, Right, Performance Unit, Restricted Stock or Incentive Shares had not been subject to approval. No Option, Right or Performance Unit may be exercised prior to such shareholder approval, and any Restricted Stock or Incentive Shares awarded will be forfeited if such shareholder approval is not obtained.
18. Term of the Plan
Unless sooner terminated by the Board pursuant to Article 14, the Plan will terminate on the date ten years after its adoption by the Board, and no Options, Rights, Performance Units, Restricted Stock or Incentive Shares may be granted or awarded after termination. The termination will not affect the validity of any Option, Right, Performance Unit, Restricted Stock or Incentive Shares outstanding on the date of termination.
69
19. Indemnification of Committee
In addition to such other rights of indemnification as they may have as Directors or as members of the Committee, the members of the Committee will be indemnified by the Company against the reasonable expenses, including attorneys’ fees, actually and reasonably incurred in connection with the defense of any action, suit or proceeding, or in connection with any appeal therein, to which they or any of them may be a party by reason of any action taken or failure to act under or in connection with the Plan or any grant or award hereunder, and against all amounts reasonably paid by them in settlement thereof or paid by them in satisfaction of a judgment in any such action, suit or proceeding, if such members acted in good faith and in a manner that they believed to be in, and not opposed to, the best interests of the Company.
20. General Provisions
20.1 The establishment of the Plan will not confer upon any Employee or Director any legal or equitable right against the Company, any Subsidiary or the Committee, except as expressly provided in the Plan.
20.2 The Plan does not constitute inducement or consideration for the employment of any Employee or the service of any Director, nor is it a contract of employment between the Company or any Subsidiary and any Employee or Director. Participation in the Plan, or the receipt of a grant or award hereunder, will not give an Employee or Director any right to be retained in the service of the Company or any Subsidiary.
20.3 The Company and its Subsidiaries may assume options, warrants, or rights to purchase stock issued or granted by other corporations whose stock or assets are acquired by the Company or its Subsidiaries, or that is merged into or consolidated with the Company. Assumed options will not be counted toward the limit specified in Section 6.3 unless the Committee determines that application of the limit is necessary for the grants of Options to qualify as “performance-based compensation” under Section 162(m) of the Code. Neither the adoption of this Plan, nor its submission to the shareholders, may be taken to impose any limitations on the powers of the Company or its affiliates to issue, grant, or assume options, warrants, rights, or restricted stock, otherwise than under this Plan, or to adopt other long-term incentive plans or to impose any requirement of shareholder approval upon the same.
20.4 The interests of any Employee or Director under the Plan are not subject to the claims of creditors and may not, in any way, be assigned, alienated or encumbered except as provided in Article 10.
20.5 The Plan will be governed, construed and administered in accordance with the laws of Ohio.
70
——————
2013 Annual Report
——————
Financial Report 2013
Management’s Responsibility for Financial Reporting
The management of The Kroger Co. has the responsibility for preparing the accompanying financial statements and for their integrity and objectivity. The statements were prepared in accordance with generally accepted accounting principles applied on a consistent basis and are not misstated due to material error or fraud. The financial statements include amounts that are based on management’s best estimates and judgments. Management also prepared the other information in the report and is responsible for its accuracy and consistency with the financial statements.
The Company’sKroger’s financial statements have been audited by PricewaterhouseCoopers LLP, an independent registered public accounting firm, whose selection has been approvedratified by the shareholders. Management has made available to PricewaterhouseCoopers LLP all of the Company’sKroger’s financial records and related data, as well as the minutes of the shareholders’ and directors’ meetings. Furthermore, management believes that all representations made to PricewaterhouseCoopers LLP during its audit were valid and appropriate.
Management also recognizes its responsibility for fostering a strong ethical climate so that the Company’sKroger’s affairs are conducted according to the highest standards of personal and corporate conduct. This responsibility is characterized and reflected inThe Kroger Co. Policy on Business Ethics, which is publicized throughout the CompanyKroger and available on the Company’sKroger’s website at ir.kroger.com.The Kroger Co. Policy on Business Ethics addresses, among other things, the necessity of ensuring open communication within the Company;Kroger; potential conflicts of interests; compliance with all domestic and foreign laws, including those related to financial disclosure; and the confidentiality of proprietary information. The CompanyKroger maintains a systematic program to assess compliance with these policies.
Management’s Report on Internal Control Over Financial ReportingMANAGEMENT’S REPORT ON INTERNAL CONTROL OVER FINANCIAL REPORTING
The management of the CompanyManagement is responsible for establishing and maintaining adequate internal control over financial reporting for the Company. With the participation of the Chief Executive Officer and the Chief Financial Officer, our management conducted an evaluation of the effectiveness of our internal control over financial reporting based on the framework and criteria established inInternal Control – Integrated Framework (2013), issued by the Committee of Sponsoring Organizations of the Treadway Commission. Our management excluded Roundy’s, Inc. from its assessment of internal control over financial reporting because it was acquired in a purchase business combination on December 18, 2015. Roundy’s, Inc. is a wholly-owned subsidiary whose total assets and total revenues represent 2% and less than 1%, respectively, of the related consolidated financial statement amounts as of and for the year ended January 30, 2016. Based on this evaluation, our management has concluded that the Company’s internal control over financial reporting was effective as of February 1, 2014.January 30, 2016.
| W. Rodney McMullen | J. Michael Schlotman |
| Chief Executive Officer | Chief Financial Officer |
A-1
Selected Financial DataSELECTED FINANCIAL DATA
Fiscal Years Ended | Fiscal Years Ended | ||||||||||||||||||||||||||||||||||||||||||||
| February 1, 2014 (52 weeks) | February 2, 2013 (53 weeks)* | January 28, 2012 (52 weeks)* | January 29, 2011 (52 weeks)* | January 30, 2010 (52 weeks)* | January 30, | January 31, | February 1, 2014 (52 weeks)(1) | February 2, 2013 (53 weeks) | January 28, 2012 (52 weeks) | ||||||||||||||||||||||||||||||||||||
(In millions, except per share amounts) | (In millions, except per share amounts) | ||||||||||||||||||||||||||||||||||||||||||||
| Sales | $ | 98,375 | $ | 96,619 | $ | 90,269 | $ | 81,967 | $ | 76,538 | $ | 109,830 | $ | 108,465 | $ | 98,375 | $ | 96,619 | $ | 90,269 | |||||||||||||||||||||||||
| Net earnings including noncontrolling | |||||||||||||||||||||||||||||||||||||||||||||
| interests | 1,531 | 1,508 | 596 | 1,133 | 57 | ||||||||||||||||||||||||||||||||||||||||
| Net earnings including | |||||||||||||||||||||||||||||||||||||||||||||
| noncontrolling interests | 2,049 | 1,747 | 1,531 | 1,508 | 596 | ||||||||||||||||||||||||||||||||||||||||
| Net earnings attributable to | |||||||||||||||||||||||||||||||||||||||||||||
| The Kroger Co. | 1,519 | 1,497 | 602 | 1,116 | 70 | 2,039 | 1,728 | 1,519 | 1,497 | 602 | |||||||||||||||||||||||||||||||||||
| Net earnings attributable to | |||||||||||||||||||||||||||||||||||||||||||||
| The Kroger Co. per diluted | |||||||||||||||||||||||||||||||||||||||||||||
| common share | 2.90 | 2.77 | 1.01 | 1.74 | 0.11 | 2.06 | 1.72 | 1.45 | 1.39 | 0.51 | |||||||||||||||||||||||||||||||||||
| Total assets | 29,281 | 24,634 | 23,454 | 23,505 | 23,126 | 33,897 | 30,497 | 29,281 | 24,634 | 23,454 | |||||||||||||||||||||||||||||||||||
| Long-term liabilities, including obligations | |||||||||||||||||||||||||||||||||||||||||||||
| under capital leases and financing | |||||||||||||||||||||||||||||||||||||||||||||
| obligations | 13,181 | 9,359 | 10,405 | 10,137 | 10,473 | ||||||||||||||||||||||||||||||||||||||||
| Total shareowners’ equity – | |||||||||||||||||||||||||||||||||||||||||||||
| Long-term liabilities, including | |||||||||||||||||||||||||||||||||||||||||||||
| obligations under capital leases | |||||||||||||||||||||||||||||||||||||||||||||
| and financing obligations | 14,123 | 13,663 | 13,181 | 9,359 | 10,405 | ||||||||||||||||||||||||||||||||||||||||
| Total shareholders’ equity – | |||||||||||||||||||||||||||||||||||||||||||||
| The Kroger Co. | 5,384 | 4,207 | 3,981 | 5,296 | 4,852 | 6,811 | 5,412 | 5,384 | 4,207 | 3,981 | |||||||||||||||||||||||||||||||||||
| Cash dividends per common share | 0.615 | 0.495 | 0.43 | 0.39 | 0.365 | 0.395 | 0.340 | 0.308 | 0.248 | 0.215 | |||||||||||||||||||||||||||||||||||
Common Share Price RangeCOMMON SHARE PRICE RANGE
| 2013 | 2012 | 2015 | 2014 | |||||||||||||||||||||
| Quarter | High | Low | High | Low | High | Low | High | Low | ||||||||||||||||
| 1st | $ | 35.44 | $ | 27.53 | $ | 24.78 | $ | 21.76 | $ | 38.87 | $ | 34.05 | $ | 23.95 | $ | 17.57 | ||||||||
| 2nd | $ | 39.98 | $ | 32.77 | $ | 23.22 | $ | 20.98 | $ | 38.65 | $ | 37.09 | $ | 25.75 | $ | 23.25 | ||||||||
| 3rd | $ | 43.85 | $ | 35.91 | $ | 25.44 | $ | 21.57 | $ | 38.73 | $ | 27.32 | $ | 29.08 | $ | 24.99 | ||||||||
| 4th | $ | 42.73 | $ | 35.71 | $ | 28.00 | $ | 24.19 | $ | 42.75 | $ | 36.00 | $ | 35.03 | $ | 28.64 | ||||||||
Main trading market: New York Stock Exchange (Symbol KR) | ||||||||||||||||||||||||
| Number of shareholders of record at year-end 2013: 30,587 | ||||||||||||||||||||||||
| Number of shareholders of record at March 28, 2014: 30,449 | ||||||||||||||||||||||||
Main trading market: New York Stock Exchange (Symbol KR) Number of shareholders of record at fiscal year-end 2015: 29,102 Number of shareholders of record at March 23, 2016: 28,959 | Main trading market: New York Stock Exchange (Symbol KR) Number of shareholders of record at fiscal year-end 2015: 29,102 Number of shareholders of record at March 23, 2016: 28,959 | |||||||||||||||||||||||
During 2012, the Company2015, we paid two quarterly cash dividends of $0.0925 per share and two quarterly cash dividends of $0.105 per share. During 2014, we paid three quarterly cash dividends of $0.115$0.0825 per share and one quarterly cash dividend of $0.15 per share. During 2013, the Company paid three quarterly dividends of $0.15 per share and one quarterly dividend of $0.165$0.0925 per share. On March 1, 2014, the Company2016, we paid a quarterly cash dividend of $0.165$0.105 per share. On March 13, 2014, the Company10, 2016, we announced that itsour Board of Directors hashave declared a quarterly cash dividend of $0.165$0.105 per share, payable on June 1, 2014,2016, to shareholders of record at the close of business on May 15, 2014.13, 2016. We currently expect to continue to pay comparable cash dividends on a quarterly basis depending on our earnings and other factors.
A-2
Performance GraphPERFORMANCE GRAPH
Set forth below is a line graph comparing the five-year cumulative total shareholder return on Kroger’sour common shares, based on the market price of the common shares and assuming reinvestment of dividends, with the cumulative total return of companies in the Standard & Poor’s 500 Stock Index and a peer group composed of food and drug companies.
COMPARISON OF CUMULATIVE FIVE-YEAR TOTAL RETURN*
Among The Kroger Co., the S&P 500, and Peer Group**
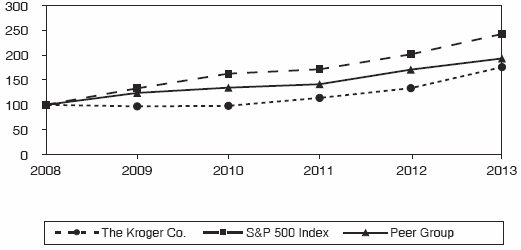
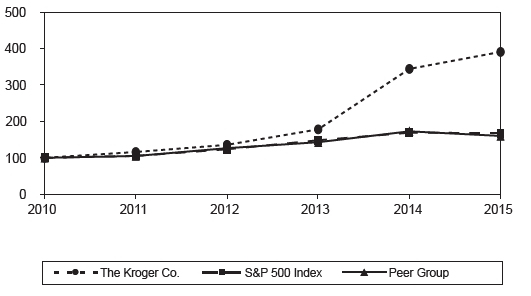
| Base | INDEXED RETURNS | Base | INDEXED RETURNS | |||||||||||||||||||||
| Period | Years Ending | Period | Years Ending | |||||||||||||||||||||
| Company Name/Index | 2008 | 2009 | 2010 | 2011 | 2012 | 2013 | 2010 | 2011 | 2012 | 2013 | 2014 | 2015 | ||||||||||||
| The Kroger Co. | 100 | 96.85 | 97.93 | 113.86 | 133.45 | 175.77 | 100 | 116.26 | 136.28 | 179.49 | 348.32 | 395.78 | ||||||||||||
| S&P 500 Index | 100 | 133.14 | 162.67 | 171.34 | 201.50 | 242.42 | 100 | 105.33 | 123.87 | 149.02 | 170.22 | 169.08 | ||||||||||||
| Peer Group | 100 | 123.89 | 134.49 | 141.36 | 170.73 | 193.17 | 100 | 105.11 | 126.94 | 143.63 | 173.96 | 161.13 | ||||||||||||
| * | Total assumes $100 invested on January | |||
| ** | The Peer Group consists of Costco Wholesale Corp., CVS Caremark Corp, | |||
| Data supplied by Standard & Poor’s. | ||||
The foregoing Performance Graph will not be deemed incorporated by reference into any other filing, absent an express reference thereto.
A-3
Issuer Purchases of Equity SecuritiesISSUER PURCHASESOF EQUITY SECURITIES
| Total Number of | Maximum Dollar | ||||||||||||||||||||||||||
| Shares | Value of Shares | ||||||||||||||||||||||||||
| Purchased as | that May Yet Be | ||||||||||||||||||||||||||
| Part of Publicly | Purchased Under | ||||||||||||||||||||||||||
| Total Number | Average | Announced | the Plans or | ||||||||||||||||||||||||
| of Shares | Price Paid | Plans or | Programs (3) | ||||||||||||||||||||||||
| Period (1) | Purchased | Per Share | Programs (2) | (in millions) | Total Number of Shares Purchased(2) | Average Price Paid Per Share | Total Number of Shares Purchased as Part of Publicly Announced Plans or Programs(3) | Maximum Dollar Value of Shares that May Yet Be Purchased Under the Plans or Programs(4) (in millions) | |||||||||||||||||||
| First period - four weeks | |||||||||||||||||||||||||||
| November 10, 2013 to December 7, 2013 | 1,525,832 | $41.99 | 1,525,832 | $281 | |||||||||||||||||||||||
| November 8, 2015 to December 5, 2015 | 94,717 | $ | 37.89 | 74,819 | $500 | ||||||||||||||||||||||
| Second period - four weeks | |||||||||||||||||||||||||||
| December 8, 2013 to January 4, 2014 | 1,776,028 | $40.04 | 1,776,028 | $214 | |||||||||||||||||||||||
| December 6, 2015 to January 2, 2016 | 906,648 | $ | 41.47 | 831,783 | $500 | ||||||||||||||||||||||
| Third period – four weeks | |||||||||||||||||||||||||||
| January 5, 2014 to February 1, 2014 | 2,407,317 | $37.91 | 2,407,317 | $129 | |||||||||||||||||||||||
| January 3, 2016 to January 30, 2016 | 213,721 | $ | 39.73 | 169,598 | $500 | ||||||||||||||||||||||
| Total | 5,709,177 | $39.66 | 5,709,177 | $129 | 1,215,086 | $ | 40.88 | 1,076,200 | $500 | ||||||||||||||||||
| (1) | The reported periods conform to | |||
| (2) | ||||
| (3) | Represents shares repurchased under the 1999 Repurchase Program. | |||
| (4) | The | |||
BusinessBUSINESS
The Kroger Co. (the “Company” or “Kroger”) was founded in 1883 and incorporated in 1902. As of February 1, 2014, the Company wasJanuary 30, 2016, we are one of the largest retailers in the world based on annual sales. The CompanyWe also manufacturesmanufacture and processesprocess some of the food for sale in itsour supermarkets. The Company’sOur principal executive offices are located at 1014 Vine Street, Cincinnati, Ohio 45202, and itsour telephone number is (513) 762-4000. The Company maintainsWe maintain a web site (www.thekrogerco.com) that includes additional information about the Company. The Company makesWe make available through itsour web site, free of charge, itsour annual reports on Form 10-K, itsour quarterly reports on Form 10-Q, itsour current reports on Form 8-K and itsour interactive data files, including amendments. These forms are available as soon as reasonably practicable after the Company haswe have filed them with, or furnished them electronically to, the SEC.
The Company’sA-4
Our revenues are predominately earned and cash is generated as consumer products are sold to customers in its stores. The Company earnsour stores and fuel centers. We earn income predominantly by selling products at price levels that produce revenues in excess of itsthe costs to make these products available to itsour customers. Such costs include procurement and distribution costs, facility occupancy and operational costs, and overhead expenses. The Company’sOur fiscal year ends on the Saturday closest to January 31. All references to 2013, 20122015, 2014 and 20112013 are to the fiscal years ended January 30, 2016, January 31, 2015 and February 1, 2014, February 2, 2013 and January 28, 2012, respectively, unless specifically indicated otherwise.
EmployeesEMPLOYEES
As of February 1, 2014, the CompanyJanuary 30, 2016, Kroger employed approximately 375,000431,000 full- and part-time employees. A majority of the Company’sour employees are covered by collective bargaining agreements negotiated with local unions affiliated with one of several different international unions. There are approximately 300350 such agreements, usually with terms of three to five years.
A-4STORES
Stores
As of February 1, 2014, the CompanyJanuary 30, 2016, Kroger operated, either directly or through its subsidiaries, 2,640 supermarkets and multi-department2,778 retail food stores 1,240under a variety of local banner names, 1,387 of which had fuel centers. Approximately 45%42% of these supermarkets were operated in Company-owned facilities, including some Company-owned buildings on leased land. The Company’sOur current strategy emphasizes self-development and ownership of store real estate. The Company’sOur stores operate under severala variety of banners that have strong local ties and brand recognition. Supermarkets are generally operated under one of the following formats: combination food and drug stores (“combo stores”); multi-department stores; marketplace stores; or price impact warehouses.
The combo stores arestore is the primary food store format. They typically draw customers from a 2 – 2½ mile radius. The Company believesWe believe this format is successful because the stores are large enough to offer the specialty departments that customerscustomers’ desire for one-stop shopping, including natural food and organic sections, pharmacies, general merchandise, pet centers and high-quality perishables such as fresh seafood and organic produce.
Multi-department stores are significantly larger in size than combo stores. In addition to the departments offered at a typical combo store, multi-department stores sell a wide selection of general merchandise items such as apparel, home fashion and furnishings, outdoor living, electronics, automotive products, toys and fine jewelry.
Marketplace stores are smaller in size than multi-department stores. They offer full-service grocery, pharmacy and health and beauty care departments as well as an expanded perishable offering and general merchandise area that includes apparel, home goods and toys.
Price impact warehouse stores offer a “no-frills, low cost” warehouse format and feature everyday low prices plus promotions for a wide selection of grocery and health and beauty care items. Quality meat, dairy, baked goods and fresh produce items provide a competitive advantage. The average size of a price impact warehouse store is similar to that of a combo store.
In addition to the supermarkets, as of February 1, 2014, the CompanyJanuary 30, 2016, we operated, through subsidiaries, 786784 convenience stores, and 320323 fine jewelry stores.stores and an online retailer. All 144121 of our fine jewelry stores located in malls are operated in leased locations. In addition, 8378 convenience stores were operated by franchisees through franchise agreements. Approximately 54% of the convenience stores operated by subsidiaries were operated in Company-owned facilities. The convenience stores offer a limited assortment of staple food items and general merchandise and, in most cases, sell gasoline.
SegmentsSEGMENTS
The Company operatesWe operate retail food and drug stores, multi-department stores, jewelry stores, and convenience stores throughout the United States. The Company’sOur retail operations, which represent over 99% of the Company’sour consolidated sales and EBITDA, are itsearnings before interest, taxes and depreciation and amortization (“EBITDA”), is our only reportable segment. The Company’sOur retail operating divisions have been aggregated into one reportable segment due to the operating divisions having similar economic characteristics with similar long-term financial performance. In addition, the Company’sour operating divisions offer to its customers similar products, have
A-5
similar distribution methods, operate in similar regulatory environments, purchase the majority of the Company’s merchandise for retail sale from similar (and in many cases identical) vendors on a coordinated basis from a centralized location, serve similar types of customers, and are allocated capital from a centralized location. The Company’sOur operating divisions reflect the manner in which the business is managed and how the Company’sour Chief Executive Officer, and Chief Operating Officer, who actacts as the Company’sour chief operating decision makers, assessmaker, assesses performance internally. All of the Company’sour operations are domestic. Revenues, profitprofits and losses and total assets are shown in the Company’sour Consolidated Financial Statements set forth in Item 8beginning on page A-29 below.
Merchandising and ManufacturingMERCHANDISING AND MANUFACTURING
Corporate brand products play an important role in the Company’sour merchandising strategy. Our supermarkets, on average, stock approximately 13,000over 14,000 private label items. The Company’sOur corporate brand products are primarily produced and sold in three “tiers.” Private SelectionSelection® is the premium quality brand designed to be a unique item in a category or to meet or beat the “gourmet” or “upscale” brands. The “banner
A-5
brand” (Kroger, Ralphs,(Kroger®, Ralphs®, Fred Meyer®, King Soopers,Soopers®, etc.), which represents the majority of the Company’sour private label items, is designed to satisfy customers with quality products. Before Krogerwe will carry a banner brand“banner brand” product we must be satisfied that the product quality meets our customers’ expectations in taste and efficacy, and we guarantee it. Kroger Value isP$$T…®, Check This Out… and Heritage Farm™ are the three value brand,brands, designed to deliver good quality at a very affordable price. In addition, the Company continueswe continue to grow itsour other brands, including Simple TruthTruth® and Simple Truth Organic.Organic®. Both Simple Truth and Simple Truth Organic are free fromFree From 101 artificial preservatives and ingredients that customers have told us they do not want in their food, and the Simple Truth Organic products are USDA certified organic.
Approximately 40% of the corporate brand units sold in our supermarkets are produced in the Company’s manufacturingour food production plants; the remaining corporate brand items are produced to the Company’sour strict specifications by outside manufacturers. The Company performsWe perform a “make or buy” analysis on corporate brand products and decisions are based upon a comparison of market-based transfer prices versus open market purchases. As of February 1, 2014, the CompanyJanuary 30, 2016, we operated 38 manufacturingfood production plants. These plants consisted of 1817 dairies, nineten deli or bakery plants, five grocery product plants, two beverage plants, two meat plants and two cheese plants.
SeasonalitySEASONALITY
The majority of our revenues are generally not seasonal in nature. However, revenues tend to be higher during the major holidays throughout the year.
Executive Officers of the RegistrantEXECUTIVE OFFICERS OF THE REGISTRANT
The disclosure regarding executive officers is set forth in Item 10 of Part III of thisthe Company’s Annual Report on Form 10-K for fiscal year 2015 under the heading “Executive Officers of the Company,” and is incorporated herein by reference.
Competitive EnvironmentCOMPETITIVE ENVIRONMENT
For the disclosure related to the Company’sour competitive environment, see Item 1A of the Company’s Annual Report on Form 10-K for fiscal year 2015 under the heading “Competitive Environment.”
A-6
Management’s Discussion and Analysis of
Financial Condition and Results of Operations
Our BusinessOUR BUSINESS
The KrogerCo. was founded in 1883 and incorporated in 1902. ItKroger is one of the nation’s largest retailers, as measured by revenue, operating 2,6402,778 supermarket and multi-department stores under two dozen banners including Kroger, City Market, Dillons, Food 4 Less, Fred Meyer, Fry’s, Harris Teeter, Jay C, King Soopers, QFC, Ralphsa variety of local banner names in 35 states and Smith’s.the District of Columbia. Of these stores, 1,2401,387 have fuel centers. We also operate 786784 convenience stores, either directly or through franchisees, and 320323 fine jewelry stores.stores and an online retailer.
Kroger operatesWe operate 38 manufacturingfood production plants, primarily bakeries and dairies, which supply approximately 40% of the corporate brand units sold in our retail outlets.supermarkets.
Our revenues are earned and cash is generated as consumer products are sold to customers in our stores. We earn income predominately by selling products at price levels that produce revenues in excess of the costs we incur to make these products available to our customers. Such costs include procurement and distribution costs, facility occupancy and operational costs, and overhead expenses. Our retail operations, which represent over 99% of Kroger’sour consolidated sales and EBITDA, areis our only reportable segment.
On December 18, 2015, we closed our merger with Roundy’s by purchasing 100% of the Roundy’s outstanding common stock for $3.60 per share and assuming Roundy’s outstanding debt, for a purchase price of $866 million. Roundy’s is included in our ending Consolidated Balance Sheets for 2015 and in our Consolidated Statements of Operations for the last six weeks of 2015. Certain year-over-year comparisons will be affected as a result. See Note 2 to the Consolidated Financial Statements for more information related to our merger with Roundy’s.
On August 18, 2014, we closed our merger with Vitacost.com by purchasing 100% of the Vitacost. com outstanding common stock for $8.00 per share or $287 million. Vitacost.com is included in our ending Consolidated Balance Sheets and Consolidated Statements of Operations for 2014 and 2015. See Note 2 to the Consolidated Financial Statements for more information related to our merger with Vitacost.com.
On January 28, 2014, we closed our merger with Harris Teeter Supermarkets, Inc. (“Harris Teeter”) by purchasing 100% of the Harris Teeter outstanding common stock for approximately $2.4 billion. The merger allows us to expand into the fast-growing southeastern and mid-Atlantic markets and into Washington, D.C. Harris Teeter is included in our ending Consolidated Balance Sheet, but becauseSheets for 2014 and 2015 and in our Consolidated Statements of Operations for 2014 and 2015. Due to the timing of the merger closing late in thefiscal year 2013, its results of operations were not material to our consolidated results of operations for 2013. Certain year-over-year comparisons will be affected as a result. See Note 2 to the Consolidated Financial Statements for more information related to our merger with Harris Teeter.
Our 2013 PerformanceOUR 2015 PERFORMANCE
We achieved outstanding results in 2013.2015. Our business strategy continues to resonate with a full range of customers and our results reflect the balance we seek to achieve across our business including positive identical supermarket sales growth, increases in loyal household count, and good cost control, as well as growth in net earnings and net earnings per diluted share. Our 20132015 net earnings were $1.5$2.0 billion or $2.90$2.06 per diluted share, compared to $1.5$1.7 billion, or $2.77$1.72 per diluted share for 2014. All share and per share amounts presented are reflective of the same periodtwo-for-one stock split that began trading at the split adjusted price on July 14, 2015.
Our net earnings for 2015 include a $110 million expense to operating, general, and administrative (“OG&A”) for certain contributions to the United Food and Commercial Workers International Union (“UFCW”) Consolidated Pension Plan (“2015 UFCW Contributions”) made during the third and fourth quarters of 2012.2015. In addition, our net earnings for 2015 include a lower last-in, first-out (“LIFO”) charge compared to 2014. Net earnings for 2014 include a net $39 million after-tax charge for an $87 million ($56 million after-tax) charge to OG&A due to the commitments and withdrawal liabilities arising from restructuring of certain multi-employer obligations (“2014 Multi-Employer Pension Plan Obligation”) to help stabilize associates’ future pension benefits, offset partially by the benefits from certain tax items of $17 million (“2014 Adjusted
A-7
Items”). In addition, our net earnings for 2014 include unusually high fuel margins, partially offset by a LIFO charge that was significantly higher than 2013 and $140 million in contributions charged to OG&A expenses for the UFCW Consolidated Pension Plan ($55 million) and The Kroger Co. Foundation ($85 million) (“2014 Contributions”). The 2015 and 2014 contributions to the UFCW Consolidated Pension Plan was to further fund the plan. The $85 million contribution, in 2014, to The Kroger Co. Foundation will enable it to continue to support causes such as hunger relief, breast cancer awareness, the military and their families and local community organizations. Fuel margin per gallon was $0.19 in 2014, compared to $0.14 in 2013. Our net earnings for 2013 include a net benefit of $23 million, which includes benefits from certain tax items of $40 million, offset partially by after-tax expensecosts of $17 million ($7$11 million in interest and $10$16 million in operating, general and administrative expenses) in costsOG&A expenses ($17 million after-tax) related to our merger with Harris Teeter (“2013 adjusted items”Adjusted Items”). See Note 5 to the Consolidated Financial Statements for more information relating to the benefits from certain tax items. For 2012, our
Our 2015 net earnings include an estimated after-tax amount of $58 millionwere $2.0 billion or $0.11$2.06 per diluted share, duecompared to a 53rd week in fiscal year 2012 (the “extra week”). In addition, 2012 net earnings benefited by $74 million after-tax$1.7 billion, or $0.14$1.72 per diluted share from a settlement with Visa and MasterCard and from a reduction in our obligation to fund the UFCW consolidated pension fund created in January 2012. Excluding the 2013 adjusted items, netfor 2014. Net earnings for 20132015 totaled $1.5$2.0 billion, or $2.85$2.06 per diluted share, compared to net earnings in 20122014 of $1.4$1.8 billion, or $2.52$1.76 per diluted share, excluding the Visa and MasterCard settlement, the UFCW consolidated pension fund adjustment and the extra week in 2012.2014 Adjusted Items. We believe adjusted net earnings and adjusted net earnings per diluted share present a more accurate year-over-year comparison of our financial results because the adjusted items2014 Adjusted Items were not directly related tothe result of our day-to-day business. After accounting for these 2013 and 2012 adjusted items, our adjustednormal operations. Our net earnings per diluted share for 2013 represents2015 represent a 13%17% increase, compared to 2012.2014 adjusted net earnings per diluted share. Please refer to the “Net Earnings” section of MD&A for more information.
Our identical supermarket sales increased 3.6%5.0%, excluding fuel, in 2013,2015, compared to 2012.2014. We have achieved 4149 consecutive quarters of positive identical supermarket sales growth, excluding fuel. As we continue to outpace many of our competitors on identical supermarket sales growth, we continue to gain market share. We focus on identical supermarket sales growth, excluding fuel, as it is a key performance target for our long-term growth strategy.
A-7
Increasing market share is an important part of our long-term strategy as it best reflects how our products and services resonate with customers. Market share growth allows us to spread the fixed costs in our business over a wider revenue base. Our fundamental operating philosophy is to maintain and increase market share by offering customers good prices and superior products and service. Based on Nielsen POS+ data, our estimatedoverall market share increasedof the products we sell in totalmarkets in which we operate increased by approximately 5040 basis points in 2013 across our 18 marketing areas outlined by the Nielsen report.2015. This informationdata also indicates that our market share increased in 16 of the marketing areas17 markets and declined in two. Wal-Mart supercenters are one of our top two competitors in 13 of these 18 marketing areas. In these 13 marketing areas, our market share increased in 12 and slightly declined in one. These market share results reflect our long-term strategy of market share growth.
Results of OperationsRESULTS OF OPERATIONS
The following discussion summarizes our operating results for 20132015 compared to 20122014 and for 20122014 compared to 2011.2013. Comparability is affected by income and expense items that fluctuated significantly between and among the periods, our merger with Roundy’s in late 2015 and an extra weekour merger with Harris Teeter in 2012.
Net Earnings
Net earnings totaled $1.5 billion in 2013, $1.5 billion in 2012late 2013. All share and $602 million in 2011. The net earnings for 2013 include a net benefit of $23 million, after tax, related to the 2013 adjusted items. The net earnings for 2012 include a benefit from net earnings of approximately $58 million, after-tax, for the extra week and a net $74 million, after-tax, benefit for the settlement with Visa and MasterCard and a reduction in our obligation to fund the UFCW consolidated pension fund created in January 2012 (“2012 adjusted items”). The net earnings for 2011 include a UFCW consolidated pension plan charge totaling $591 million, after-tax (“2011 adjusted item”). Excluding these benefits and charges for adjusted items in 2013, 2012 and 2011, adjusted net earnings were $1.5 billion in 2013, $1.4 billion in 2012 and $1.2 billion in 2011. 2013 adjusted net earnings improved, compared to adjusted net earnings in 2012, due to an increase in first-in, first-out (“FIFO”) non-fuel operating profit and decreased interest expense, partially offset by increased income tax expense. 2012 adjusted net earnings improved, compared to adjusted net earnings in 2011, due to an increase in FIFO non-fuel operating profit, increased net earnings from our fuel operations and a last-in, first-out (“LIFO”) charge of $55 million (pre-tax), compared to a LIFO charge of $216 million (pre-tax) in 2011, partially offset by increased interest expense and income tax expense.
2013 net earnings per diluted share totaled $2.90, and adjusted net earnings per diluted share totaled $2.85, which excludes the 2013 adjusted items. 2012 net earnings per diluted share totaled $2.77, and adjusted net earnings per diluted share totaled $2.52, which excludes the 2012 adjusted items. 2011 net earnings per diluted share totaled $1.01, and adjusted net earnings per diluted share in 2011 totaled $2.00, which excludes the 2011 adjusted item. Adjusted net earnings per diluted share in 2013, compared to adjusted net earnings per diluted share in 2012, increased primarily due to fewer shares outstanding as a resultamounts presented below are reflective of the repurchase of Kroger common shares, increased FIFO non-fuel operating profit and decreased interest expense, partially offset by increased income tax expense. Adjusted net earnings per diluted share in 2012, compared totwo-for-one stock split that began trading at the split adjusted net earnings per diluted share in 2011, increased primarily due to fewer shares outstanding as a result of the repurchase of Kroger common shares, increased FIFO non-fuel operating profit, increased net earnings from our fuel operations and a decrease in the LIFO charge to $55 million (pre-tax), compared to a LIFO charge of $216 million (pre-tax) in 2011, partially offset by increased interest expense and income tax expense.price on July 14, 2015.
Management believes adjusted net earnings (and adjusted net earnings per diluted share) are useful metrics to investors and analysts because they more accurately reflect our day-to-day business operations than do the adjusted items referenced above ingenerally accepted accounting principle (“GAAP”) measures of net earnings and net earnings per diluted share are not directly related to our day-to-day business.share. Adjusted net earnings (and adjusted net earnings per diluted share) are non-generally accepted accounting principle (“non-GAAP”) financial measures and should not be considered alternatives to net earnings (and net earnings per diluted share) or any other generally accepted accounting principle (“GAAP”)GAAP measure of performance. Adjusted net earnings (and adjusted net earnings per diluted share) should not be reviewedviewed in isolation or considered substitutes for our financial results as reported in accordance with GAAP. Management uses adjusted net earnings (and adjusted net earnings per diluted share) in evaluating our results of operations as it believes these measures are more meaningful indicators of ongoing operating performance since, as adjusted, those earnings relate more directly to our day-to-day operations. Management also uses adjusted net earnings (and adjusted net earnings per diluted share) as a performance metric for management incentive programs, and to measure our progress against internal budgets and targets. In addition, management takes into account adjusted net earnings when calculating management incentive programs.
A-8
Net Earnings
Net earnings totaled $2.0 billion in 2015, $1.7 billion in 2014 and $1.5 billion in 2013. Net earnings improved in 2015, compared to net earnings in 2014, due to an increase in operating profit, partially offset by an increase in income tax expense. Operating profit increased in 2015, compared to 2014, primarily due to an increase in first-in, first-out (“FIFO”) non-fuel operating profit, lower charges for total contributions to The Kroger Co. Foundation, UFCW Consolidated Pension Plan, the charge related to the 2014 Multi-Employer Pension Plan Obligation and a lower LIFO charge which was $28 million (pre-tax), compared to a LIFO charge of $147 million (pre-tax) in 2014, partially offset by a decrease in fuel operating profit and continued investments in lower prices for our customers. The decrease in fuel operating profit was primarily due to a decrease in fuel margin per gallon to $0.17 in 2015, compared to $0.19 in 2014, partially offset by an increase in fuel gallons sold. Continued investments in lower prices for our customers includes our pharmacy department, which experienced high levels of inflation that were not fully passed on to the customer in 2015. Net earnings improved in 2014, compared to net earnings in 2013, due to an increase in operating profit, partially offset by increases in interest and income tax expense. Operating profit increased in 2014, compared to 2013, primarily due to an increase in FIFO non-fuel operating profit, excluding Harris Teeter, the effect of our merger with Harris Teeter and an increase in fuel operating profit, partially offset by continued investments in lower prices for our customers, the 2014 Contributions, the charge related to the 2014 Multi-Employer Pension Plan Obligation and a higher LIFO charge which was $147 million (pre-tax), compared to a LIFO charge of $52 million (pre-tax) in 2013.
The net earnings for 2015 do not include any non-GAAP adjustments. The net earnings for 2014 include a net charge of $39 million, after tax, related to the 2014 Adjusted Items. The net earnings for 2013 include a net benefit of $23 million, after tax, related to the 2013 Adjusted Items. Excluding these benefits and charges for Adjusted Items for 2014 and 2013, adjusted net earnings were $2.0 billion in 2015, $1.8 billion in 2014 and $1.5 billion in 2013. 2015 net earnings improved, compared to adjusted net earnings in 2014, due to an increase in FIFO non-fuel operating profit, lower charges for total contributions to The Kroger Co. Foundation and UFCW Consolidated Pension Plan and a lower LIFO charge which was $28 million (pre-tax), compared to a LIFO charge of $147 million (pre-tax) in 2014, partially offset by continued investments in lower prices for our customers, a decrease in fuel operating profit and an increase in income tax expense. Continued investments in lower prices for our customers includes our pharmacy department, which experienced high levels of inflation that were not fully passed on to the customer in 2015. 2014 adjusted net earnings improved, compared to adjusted net earnings in 2013, due to an increase in FIFO non-fuel operating profit, excluding Harris Teeter, the effect of our merger with Harris Teeter and an increase in fuel operating profit, partially offset by continued investments in lower prices for our customers, the 2014 Contributions, increases in interest and income tax expense and a higher LIFO charge which was $147 million (pre-tax), compared to a LIFO charge of $52 million (pre-tax) in 2013.
Net earnings per diluted share totaled $2.06 in 2015, $1.72 in 2014 and $1.45 in 2013. Net earnings per diluted share in 2015, compared to 2014, increased primarily due to fewer shares outstanding as a result of the repurchase of Kroger common shares and an increase in net earnings. Net earnings per diluted share in 2014, compared to 2013, increased primarily due to fewer shares outstanding as a result of the repurchase of Kroger common shares and an increase in net earnings.
There were no adjustment items in 2015, but excluding the 2014 and 2013 Adjusted Items, adjusted net earnings per diluted share totaled $1.76 in 2014 and $1.43 in 2013. Net earnings per diluted share in 2015, compared to adjusted net earnings per diluted share in 2014, increased primarily due to fewer shares outstanding as a result of the repurchase of Kroger common shares and an increase in adjusted net earnings. Adjusted net earnings per diluted share in 2014, compared to adjusted net earnings per diluted share in 2013, increased primarily due to fewer shares outstanding as a result of the repurchase of Kroger common shares and an increase in adjusted net earnings.
A-9
The following table provides a reconciliation of net earnings attributable to The Kroger Co. to net earnings attributable to The Kroger Co. excluding the adjusted itemsAdjusted Items for 2014 and 2013 and a reconciliation of net earnings attributable to The Kroger Co. per diluted common share to the net earnings attributable to The Kroger Co. per diluted common share excluding the adjustedAdjusted Items for 2014 and 2013. In 2015, we did not have any adjustment items for 2013, 2012 and 2011:that affect net earnings or net earnings per diluted share.
Net Earnings per Diluted Share excluding the AdjustmentAdjusted Items
(in millions, except per share amounts)
| 2013 | 2012 | 2011 | |||||||||
| Net earnings attributable to The Kroger Co. | $ | 1,519 | $ | 1,497 | $ | 602 | |||||
| Benefit from certain tax items offset by Harris Teeter merger costs (1) | (23 | ) | — | — | |||||||
| 53rdweek adjustment (1) | — | (58 | ) | — | |||||||
| Adjustment for the UFCW consolidated pension plan liability and | |||||||||||
| credit card settlement (1) | — | (74 | ) | — | |||||||
| UFCW pension plan consolidation charge (1) | — | — | 591 | ||||||||
| Net earnings attributable to The Kroger Co. excluding the adjustment | |||||||||||
| items above | $ | 1,496 | $ | 1,365 | $ | 1,193 | |||||
| Net Earnings attributable to The Kroger Co. per diluted common share | $ | 2.90 | $ | 2.77 | $ | 1.01 | |||||
| Benefit from certain tax items offset by Harris Teeter merger costs (2) | (0.05 | ) | — | — | |||||||
| 53rdweek adjustment (2) | — | (0.11 | ) | — | |||||||
| Adjustments for the UFCW consolidated pension plan liability and | |||||||||||
| credit card settlement (2) | — | (0.14 | ) | — | |||||||
| UFCW pension plan consolidation charge (2) | — | — | 0.99 | ||||||||
| Net earnings attributable to The Kroger Co. per diluted common | |||||||||||
| share excluding the adjustment items above | $ | 2.85 | $ | 2.52 | $ | 2.00 | |||||
| Average numbers of common shares used in diluted calculation | 520 | 537 | 593 | ||||||||
| 2015 | 2014 | 2013 | ||||||||
| Net earnings attributable to The Kroger Co. | $ | 2,039 | $ | 1,728 | $ | 1,519 | ||||
| 2014 Adjusted Items | — | 39 | — | |||||||
| 2013 Adjusted Items | — | — | (23 | ) | ||||||
| Net earnings attributable to The Kroger Co. excluding the | ||||||||||
| adjustment items above | $ | 2,039 | $ | 1,767 | $ | 1,496 | ||||
| Net earnings attributable to The Kroger Co. per diluted common share | $ | 2.06 | $ | 1.72 | $ | 1.45 | ||||
| 2014 Adjusted Items(1) | — | 0.04 | — | |||||||
| 2013 Adjusted Items(1) | — | — | (0.02 | ) | ||||||
| Net earnings attributable to The Kroger Co. per diluted common share | ||||||||||
| excluding the adjustment items above | $ | 2.06 | $ | 1.76 | $ | 1.43 | ||||
| Average numbers of common shares used in diluted calculation | 980 | 993 | 1,040 | |||||||
| (1) | ||
| The amounts presented represent the net earnings per diluted common share effect of each |
Sales
| Total Sales | |||||||||||||||||||||||||||||||||||||
| (in millions) | |||||||||||||||||||||||||||||||||||||
| Total Sales | |||||||||||||||||||||||||||||||||||||
| (in millions) | |||||||||||||||||||||||||||||||||||||
| Percentage | 2012 | Percentage | Percentage | Percentage | |||||||||||||||||||||||||||||||||
| 2013 | Increase (2) | 2012 | Adjusted (3) | Increase (4) | 2011 | 2015 | Increase(2) | 2014 | Increase(3) | 2013 | |||||||||||||||||||||||||||
| Total supermarket sales | |||||||||||||||||||||||||||||||||||||
| without fuel | $ | 76,666 | 4.0% | $ | 75,179 | $ | 73,733 | 3.8% | $ | 71,004 | $ | 91,310 | 5.8 | % | $ | 86,281 | 12.5 | % | $ | 76,666 | |||||||||||||||||
| Fuel sales | 18,962 | 3.0% | 18,896 | 18,413 | 8.9% | 16,901 | 14,804 | (21.5 | % | ) | 18,850 | (0.6 | %) | 18,962 | |||||||||||||||||||||||
| Other sales (1) | 2,747 | 9.2% | 2,544 | 2,515 | 6.4% | 2,364 | 3,716 | 11.5 | % | 3,334 | 21.4 | % | 2,747 | ||||||||||||||||||||||||
| Total sales | $ | 98,375 | 3.9% | $ | 96,619 | $ | 94,661 | 4.9% | $ | 90,269 | $ | 109,830 | 1.3 | % | $ | 108,465 | 10.3 | % | $ | 98,375 | |||||||||||||||||
| (1) | Other sales primarily relate to sales at convenience stores, excluding fuel; jewelry stores; | |||
| (2) | This column represents the sales percentage | |||
| (3) | ||||
| This column represents the sales percentage | ||||
A-9
Total sales increased in 2013,2015, compared to 2012,2014, by 1.82%1.3%. TheThis increase in 20132015 total sales, compared to 2012,2014, was primarily due to our identical supermarket sales increase, excluding fuel, of 3.6%, partially offset by the extra week in fiscal 2012. Total sales increased in 2013, compared to 2012 adjusted total sales, by 3.9%. The increase in 2013 total sales, compared to 2012 adjusted total sales, was primarily due to our identical supermarket sales increase, excluding fuel, of 3.6%. Identical supermarket sales, excluding fuel, increased in 2013, compared to 2012, primarily due to an increase in average sale per customer, partiallyidentical supermarket sales, excluding fuel, of 5.0%. Total sales also increased due to inflation, and an increase in the transaction count.
Totalinclusion of Roundy’s sales, increased in 2012, compared to 2011, by 7.0%. The increase in 2012 total sales, compared to 2011, was primarily due to our identical supermarket sales increase, excluding fuel,merger, for the period of 3.5%, increased fuel sales of 8.9% and the extra week in fiscal 2012. Adjusted total sales increased in 2012, comparedDecember 18, 2015 to 2011, by 4.9%. The increase in 2012 adjusted total sales, compared to 2011 total sales, was primarily due to our identical supermarket sales increase, excluding fuel, of 3.5% and an increase in fuel sales of 8.9%.January 30, 2016. Identical supermarket sales, excluding fuel, increased in 2012, adjusted for the extra week,2015, compared to 2011,2014, increased primarily due to an increase in the average sale per customer, partially due to inflation, andnumber of households shopping with us, an increase in the transaction count.visits per household, changes in product mix and product cost inflation. Total fuel sales increaseddecreased in 2012, adjusted for the extra week,2015, compared to 2011,2014, primarily due to a 26.7% decrease in the average retail fuel price, partially offset by an increase in fuel gallons sold of 7.8%7.1%.
Total sales increased in 2014, compared to 2013, by 10.3%. This increase in 2014 total sales, compared to 2013, was primarily due to our merger with Harris Teeter, which closed on January 28, 2014, and an increase in identical supermarket sales, excluding fuel, of 5.2%. Identical supermarket
A-10
sales, excluding fuel for 2014, compared to 2013, increased primarily due to an increase in the number of households shopping with us, an increase in visits per household and product cost inflation. Total fuel sales decreased in 2014, compared to 2013, primarily due to a 6.8% decrease in the average retail fuel price, of 1.7%. The increase in the average retail fuel price was causedpartially offset by an increase in the product costfuel gallons sold of fuel.6.6%.
We define a supermarket as identical when it has been in operation without expansion or relocation for five full quarters. Although identical supermarket sales is a relatively standard term, numerous methods exist for calculating identical supermarket sales growth. As a result, the method used by our management to calculate identical supermarket sales may differ from methods other companies use to calculate identical supermarket sales. We urge you to understand the methods used by other companies to calculate identical supermarket sales before comparing our identical supermarket sales to those of other such companies. Fuel discounts received at our fuel centers and earned based on in-store purchases are included in all of the supermarket identical sales results calculations illustrated below and reduce our identical supermarket sales results. Differences between total supermarket sales and identical supermarket sales primarily relate to changes in supermarket square footage. Identical supermarket sales include sales from all departments at identical Fred Meyer multi-department stores.stores and include Roundy’s sales for the last six weeks of fiscal 2015 for stores that are identical as if they were part of the Company in the prior year. We calculate annualized identical supermarket sales by adding together four quarters of identical supermarket sales. Our identical supermarket sales results are summarized in the table below, based on the 52-week period of 2013, compared to the previous year results adjusted to a comparable 52 week period.below.
Identical Supermarket Sales
(dollars in millions)
| 2013 | 2012 (1) | |||||||
| Including supermarket fuel centers | $ | 88,482 | $ | 85,661 | ||||
| Excluding supermarket fuel centers | $ | 74,095 | $ | 71,541 | ||||
| Including supermarket fuel centers | 3.3 | % | 4.5 | % | ||||
| Excluding supermarket fuel centers | 3.6 | % | 3.5 | % | ||||
A-10
| 2015 | 2014 | |||||||
| Including supermarket fuel centers | $ | 98,916 | $ | 97,813 | ||||
| Excluding supermarket fuel centers | $ | 87,553 | $ | 83,349 | ||||
| Including supermarket fuel centers | 1.1 | % | 4.2 | % | ||||
| Excluding supermarket fuel centers | 5.0 | % | 5.2 | % | ||||
Gross Margin and FIFO Gross Margin
We calculate gross margin as sales less merchandise costs, including advertising, warehousing, and transportation expenses. Merchandise costs exclude depreciation and rent expenses. Our gross margin rates, as a percentage of sales, were 22.16% in 2015, 21.16% in 2014 and 20.57% in 2013, 20.59%2013. The increase in 2012 and 20.92% in 2011. The decrease in 2013,2015, compared to 2012,2014, resulted primarily from a decrease in retail fuel sales and reductions in transportation costs and a decrease in our LIFO charge, as a percentage of sales, partially offset by continued investments in lower prices for our customers and increased shrink costs, as a percentage of sales. The increase in 2014, compared to 2013, resulted primarily from the effect of our merger with Harris Teeter, an increase in fuel gross margin rate and advertisinga reduction in warehouse and transportation costs, as a percentage of sales, partially offset partially by continued investments in lower prices for our customers and an increase in our LIFO charge, as a growthpercentage of sales. The merger with Harris Teeter, which closed late in fiscal year 2013, had a positive effect on our gross margin rate in retail fuel sales that was lower than the2014 since Harris Teeter has a higher gross margin rate as compared to total Company sales growth rate.without Harris Teeter. The increase in fuel gross margin rate for 2014, compared to 2013, resulted primarily from an increase in fuel margin per gallon sold of $0.19 in 2014, compared to $0.14 in 2013. Our retail fuel operations lower our gross margin rate, as a percentage of sales, due to the very low gross margin on retail fuel sales as compared to non-fuel sales. A lower growth rate in retail fuel sales, as compared to the growth rate for the total Company, increases the gross margin rates, as a percentage of sales, when compared to the prior year. The decrease in gross margin rates in 2012, compared to 2011, resulted primarily from a higher growth rate in fuel sales, as compared to the growth rate for the total Company, continued investments in lower prices for our customers and increased shrink and warehousing costs, as a percentage of sales, offset partially by a decrease in the LIFO charge as a percentage of sales.
We calculate FIFO gross margin as sales minusless merchandise costs, including advertising, warehousing, and transportation expenses, but excluding the LIFO charge. Merchandise costs exclude depreciation and rent expenses. Our LIFO charge was $28 million in 2015, $147 million in 2014 and $52 million in 2013, $55 million in 2012 and $216 million in 2011.2013. FIFO gross margin is a non-GAAP financial measure and should not be considered as an alternative to gross margin or any other GAAP measure of performance. FIFO gross margin should not be reviewed in isolation or considered as a substitute for our financial results as reported in accordance
A-11
with GAAP. FIFO gross margin is an important measure used by management to evaluate merchandising and operational effectiveness. Management believes FIFO gross margin is a useful metric to investors and analysts because it measures our day-to-day merchandising and operational effectiveness.
Our FIFO gross margin rates, as a percentage of sales, were 22.18% in 2015, 21.30% in 2014 and 20.62% in 2013, 20.65% in 2012 and 21.15% in 2011.2013. Our retail fuel operations lower our FIFO gross margin rate, as a percentage of sales, due to the very low FIFO gross margin rate on retail fuel sales as compared to non-fuel sales. Excluding the effect of retail fuel operations, our FIFO gross margin rate decreased 14four basis points in 2013,2015, as a percentage of sales, compared to 2012. This2014. The decrease in 2013,FIFO gross margin rates, excluding retail fuel, in 2015, compared to 2012,2014, resulted primarily from continued investments in lower prices for our customers and increased shrink and advertisingcosts, partially offset by a reduction in transportation costs, as a percentage of sales. Excluding the effect of retail fuel, operations, our FIFO gross margin rate decreased 40three basis points in 2012,2014, as a percentage of sales, compared to 2011. This2013. The decrease in 2012,FIFO gross margin rates, excluding retail fuel, in 2014, compared to 2011,2013, resulted primarily from continued investments in lower prices for our customers, offset partially by the effect of our merger with Harris Teeter and increased shrinka reduction of warehouse and warehousingtransportation costs, as a percentage of sales.
LIFO Charge
The LIFO charge was $28 million in 2015, $147 million in 2014 and $52 million in 2013, $55 million in 2012 and $216 million in 2011. We2013. In 2015, we experienced relatively consistent levels oflower product cost inflation, in 2013, compared to 2012.2014, which resulted in a lower LIFO charge. In 2015, our LIFO charge primarily resulted from annualized product cost inflation related to pharmacy, and was partially offset by annualized product cost deflation related to meat and dairy. In 2014, we experienced higher product cost inflation, compared to 2013, which resulted in a higher LIFO charge. In 2014, our LIFO charge primarily resulted from annualized product cost inflation related to pharmacy, grocery, deli, meat and seafood. In 2013, our LIFO charge resulted primarily from an annualized product cost inflation related to meat, seafood and pharmacy. In 2012, our LIFO charge resulted primarily from an annualized product cost inflation related to grocery, natural foods, meat, deli and bakery, general merchandise and grocery, partially offset by deflation in seafood and manufactured product. In 2012, we experienced lower levels of product cost inflation, compared to 2011. In 2011, our LIFO charge primarily resulted from an annualized product cost inflation related to grocery, meat and seafood, deli and bakery, and pharmacy.
A-11
Operating, General and Administrative Expenses
Operating, general and administrative (“OG&A”)&A expenses consist primarily of employee-related costs such as wages, health care benefits and retirement plan costs, utilities and credit card fees. Rent expense, depreciation and amortization expense and interest expense are not included in OG&A.
OG&A expenses, as a percentage of sales, were 16.34% in 2015, 15.82% in 2014 and 15.45% in 2013, 15.37%2013. The increase in 2012 and 17.00% in 2011. Excluding the 2013, 2012 and 2011 adjusted items, OG&A expenses, as a percentage of sales, were 15.43% in 2015, compared to 2014, resulted primarily from a decrease in retail fuel sales, increases in EMV chargebacks, company sponsored pension, healthcare and incentive plan costs, as a percentage of sales, partially offset by increased supermarket sales, the 2014 Multi-Employer Pension Plan Obligation, lower charges for total contributions to The Kroger Foundation and UFCW Consolidated Pension Plan, productivity improvements and effective cost controls at the store level. The increase in OG&A expenses, as a percentage of sales, in 2014, compared to 2013, 15.52%resulted primarily from the 2014 Contributions, the 2014 Multi-Employer Pension Plan Obligation, the effect of fuel, the effect of our merger with Harris Teeter and increases in 2012credit card fees and 15.94%incentive plan costs, as a percentage of sales, partially offset by increased supermarket sales growth, productivity improvements and effective cost controls at the store level. Retail fuel sales lower our OG&A rate due to the very low OG&A rate, as a percentage of sales, of retail fuel sales compared to non-fuel sales. The merger with Harris Teeter, which closed late in 2011. fiscal year 2013, increased our OG&A rate, as a percentage of sales, since Harris Teeter has a higher OG&A rate as compared to the total Company without Harris Teeter.
Our retail fuel operations reduce our overall OG&A rate, as a percentage of sales, due to the very low OG&A rate on retail fuel sales as compared to non-fuel sales. OG&A expenses, as a percentage of sales excluding fuel, the 2015 UFCW Contributions, the 2014 Contributions and the 2013 adjusted items,2014 Multi-Employer Pension Plan Obligation, decreased 179 basis points, in 2013, compared to 2012,2014. The decrease in our adjusted for the 2012 adjusted items. This decreaseOG&A rate in 2015, compared to 2014, resulted primarily from increased identicalsupermarket sales, productivity improvements and effective cost controls at the store level, partially offset by increases in
A-12
EMV chargebacks, company sponsored pension, healthcare and incentive plan costs, as a percentage of sales. OG&A expenses, as a percentage of sales excluding fuel, the 2014 Contributions and the 2014 Multi-Employer Pension Plan Obligation, decreased 19 basis points in 2014, compared to 2013, adjusted for the 2013 Adjusted Items. The decrease in our adjusted OG&A rate in 2014, compared to 2013, resulted primarily from increased supermarket sales growth, productivity improvements and effective cost controls at the store level, offset partially by increasedthe effect of our merger with Harris Teeter and increases in credit card fees and incentive compensation. OG&A expenses,plan costs, as a percentage of sales excluding fuel and the 2012 adjusted items, decreased 36 basis points in 2012, compared to 2011, adjusted for the 2011 adjusted items. This decrease resulted primarily from increased identical supermarket sales growth, productivity improvements, effective cost controls at the store level, the benefit received in lower operating expenses from the consolidation of four UFCW multi-employer pension plans in the prior year and decreased incentive compensation, offset partially by increased healthcare costs.sales.
Rent Expense
Rent expense was $723 million in 2015, compared to $707 million in 2014 and $613 million in 2013, as compared to $628 million in 2012 and $619 million in 2011.2013. Rent expense, as a percentage of sales, was 0.62%0.66% in 2013, as2015, compared to 0.65% in 20122014 and 0.69%0.62% in 2011.2013. Rent expense as a percentage of sales excluding fuel, decreased four basis pointsincreased in 2013,2015, compared to 2012 and four basis points in 2012, compared2014, due to 2011. These continual decreases in rent expense, as a percentagethe effect of sales both including and excluding fuel, reflectsour merger with Roundy’s, partially offset by our continued emphasis on owning rather than leasing, whenever possible. Rent expense, as a percentage of sales, in 2015 was consistent with 2014 due to the effect of our merger with Roundy’s, partially offset by our continued emphasis to own rather than lease, whenever possible, and the benefit of increased sales. The increase in rent expense, as a percentage of sales, in 2014, compared to 2013, is due to the effect of our merger with Harris Teeter, partially offset by our continued emphasis to own rather than lease, whenever possible, and the benefit of increased sales. The merger with Harris Teeter, which closed late in fiscal year 2013, increased rent expense, as a percentage of sales, since Harris Teeter has a higher rent expense rate compared to the total Company without Harris Teeter.
Depreciation and Amortization Expense
Depreciation and amortization expense was $2.1 billion, compared to $1.9 billion in 2014 and $1.7 billion in both 2013 and 2012 and $1.6 billion in 2011.2013. Depreciation and amortization expense, as a percentage of sales, was 1.90% in 2015, 1.80% in 2014 and 1.73% in 2013, 1.71%2013. The increase in 2012depreciation and 1.81%amortization expense for 2015, compared to 2014, was the result of additional depreciation due to our merger with Roundy’s and on capital investments, including mergers and lease buyouts, of $3.4 billion, excluding Roundy’s. The increase in 2011. Excluding the extra week in 2012, depreciation and amortization expense, as a percentage of sales, from 2015, compared to 2014, is primarily due to the additional depreciation resulting from our increased capital investments, including mergers and lease buyouts in 2015, compared to 2014. The increase in depreciation and amortization expense for 2014, compared to 2013, in total dollars, was 1.74%due to the effect of our merger with Harris Teeter and our increased spending in 2012. Depreciationcapital investments, including mergers and lease buyouts, of $3.1 billion in 2014. The increase in depreciation and amortization expense, as a percentage of sales, excluding fuel and the extra week in 2012, decreased three basis points in 2013,from 2014, compared to 20122013, is primarily due to the effect of our merger with Harris Teeter and seven basis pointsour increased spending in 2012, compared to 2011. These continual decreasescapital investments, partially offset by increased supermarket sales. The merger with Harris Teeter, which closed late in fiscal year 2013, increased our depreciation and amortization expense, excluding the extra week in 2012, as a percentage of sales, both including and excluding fuel, are primarilysince Harris Teeter has a higher depreciation expense rate as compared to the result of increasing sales, offset partially by our increased spending in capital investments.total Company without Harris Teeter.
Operating Profit and Adjusted FIFO Operating Profit
Operating profit was $3.6 billion in 2015, $3.1 billion in 2014 and $2.7 billion in 2013, $2.8 billion in 2012 and $1.3 billion in 2011. Excluding the extra week, operating profit was $2.7 billion in 2012.2013. Operating profit, as a percentage of sales, was 3.26% in 2015, 2.89% in 2014 and 2.77% in 2013, 2.86% in 2012 and 1.42% in 2011.2013. Operating profit, as a percentage of sales, excludingincreased 37 basis points in 2015, compared to 2014, primarily from increased supermarket sales, a LIFO charge that was significantly lower in 2015, lower charges for total contributions to The Kroger Co. Foundation and UFCW Consolidated Pension Plan, the extra week2014 Multi-Employer Pension Obligation, productivity improvements, effective cost controls at the store level, and reductions in 2012, was 2.81%. Operatingtransportation costs, as a percentage of sales, partially offset by the effect of our merger with Roundy’s, continued investments in lower prices for our customers, a decrease in operating profit excludingfrom our fuel operations, an increase in depreciation and amortization expense and increases in EMV chargebacks, company sponsored pension, healthcare, incentive plan and shrink costs, as a percentage of sales. The decrease in operating profit from our fuel operations for 2015, compared to 2014, resulted primarily from a decrease in the 2013, 2012 and 2011 adjusted items, was $2.7 billionaverage margin per gallon of fuel sold, partially offset by an increase in 2013, $2.6 billion in 2012 and $2.2 billion in 2011.
A-13
fuel gallons sold. Operating profit, as a percentage of sales, excludingincreased 12 basis points in 2014, compared to 2013, primarily from the 2013, 2012effect of our merger with Harris Teeter, an increase in fuel gross margin rate and 2011 adjusted items, was 2.79%a reduction in 2013, 2.69% in 2012warehouse and 2.47% in 2011.
Operating profit,transportation costs, rent and depreciation and amortization expenses, as a percentage of sales, excluding the 2013 and 2012 adjusted items, increased 10 basis points in 2013, compared to 2012, primarily due to improvements in operating, general and administrative expenses, rent and depreciation, as a percentage of sales,partially offset partially by continued investments in lower prices for our customers and increased shrink and advertising costs, as a percentage of sales. Operating profit, as a percentage of sales excluding the 2012 and 2011 adjusted items, increased 22 basis pointsan increase in 2012, compared to 2011, primarily due to improvements in operating, general and administrative expenses, rent, depreciation and the LIFO charge, as a percentage of sales, offset partially by continued investments in lower prices for our customers and increased shrink and warehousing costs, as a percentage of sales.
A-12
We calculate FIFO operating profit as operating profit excluding the LIFO charge. FIFO operating profit is a non-GAAP financial measure and should not be considered as an alternative to operating profit or any other GAAP measure of performance. FIFO operating profit should not be reviewed in isolation or considered as a substitute for our financial results as reported in accordance with GAAP. FIFO operating profit is an important measure used by management to evaluate operational effectiveness. Management believes FIFO operating profit is a useful metric to investors and analysts because it measures our day-to-day merchandising and operational effectiveness. Since fuel discounts are earned based on in-store purchases, fuel operating profit does not include fuel discounts, which are allocated to our in-store supermarket location departments. We also derive operating, general and administrative expenses,OG&A, rent and depreciation and amortization expenses through the use of estimated allocations in the calculation of fuel operating profit.
FIFO operating profit was $3.6 billion in 2015, $3.3 billion in 2014 and $2.8 billion in 2013 and 2012, and $1.5 billion in 2011. Excluding the extra week in 2012, FIFO operating profit was $2.7 billion.2013. FIFO operating profit, as a percentage of sales, was 3.28% in 2015, 3.03% in 2014 and 2.82% in 2013. FIFO operating profit, excluding the 2015 UFCW Contributions, the 2014 Contributions, the 2014 Multi-Employer Pension Plan Obligation and 2013 2.92%Adjusted Items, was $3.7 billion in 20122015, $3.5 billion in 2014 and 1.66%$2.8 billion in 2011.2013. FIFO operating profit, as a percentage of sales excluding the extra week2015 UFCW Contributions, the 2014 Contributions, the 2014 Multi-Employer Pension Plan Obligation and 2013 Adjusted Items, was 3.38% in 2012, was 2.87%. FIFO operating profit, excluding the 2013, 2012,2015, 3.24% in 2014 and 2011 adjusted items, was $2.8 billion in 2013, $2.6 billion in 2012 and $2.4 billion in 2011. FIFO operating profit, as a percentage of sales excluding the 2013, 2012, and 2011 adjusted items, was 2.84% in 2013, 2.75% in 2012, and 2.71% in 2011.2013.
Retail fuel sales lower our overall FIFO operating profit rate due to the very low FIFO operating profit rate, as a percentage of sales, of retail fuel sales compared to non-fuel sales. FIFO operating profit, as a percentage of sales excluding fuel, was $2.6 billionthe 2015 UFCW Contributions, the 2014 Contributions and the 2014 Multi-Employer Pension Plan Obligation, increased 5 basis points in 2013 and 2012, and $1.3 billion2015, compared to 2014. The increase in 2011. Excluding the extra week,our adjusted FIFO operating profit excluding fuel,rate in 2015, compared to 2014, was $2.5 billionprimarily due to increased supermarket sales, productivity improvements, effective cost controls at the store level and reductions in 2012.transportation costs, as a percentage of sales, partially offset by continued investments in lower prices for our customers, the effect of our merger with Roundy’s, an increase in depreciation and amortization expense and increases in EMV chargebacks, company sponsored pension, healthcare, incentive plan and shrink costs, as a percentage of sales. Excluding the effects of our merger with Roundy’s, FIFO operating profit increased 8 basis points in 2015, compared to 2014. FIFO operating profit, as a percentage of sales, excluding fuel, was 3.22%the 2014 Contributions and the 2014 Multi-Employer Pension Plan Obligation, increased 10 basis points in 2014, compared to 2013, 3.35%adjusted for the 2013 Adjusted Items. The increase in 2012, and 1.77% in 2011. Excluding the extra week,our adjusted FIFO operating profit rate in 2014, compared to 2013, was primarily due to the effect of our merger with Harris Teeter and a reduction in warehouse and transportation costs, improvements in OG&A, rent and depreciation and amortization expense, as a percentage of sales, excluding fuel, was 3.28% in 2012. FIFO operating profit, excluding fuel and the 2013, 2012 and 2011 adjusted items, was $2.6 billion in 2013, $2.4 billion in 2012 and $2.3 billion in 2011. FIFO operating profit, as a percentage of sales excluding fuel and the 2013, 2012, and 2011 adjusted items, was 3.24% in 2013, 3.13% in 2012 and 3.07% in 2011.
Excluding fuel, FIFO operating profit, as a percentage of sales excluding the 2013 and 2012 adjusted items, increased 11 basis points in 2013, compared to 2012, primarily due to improvements in OG&A expenses, rent and depreciation, as a percentage of sales,partially offset partially by continued investments in lower prices for our customerscustomers.
Interest Expense
Interest expense totaled $482 million in 2015, $488 million in 2014 and increased shrink and advertising costs, as a percentage of sales. Excluding fuel, FIFO operating profit, as a percentage of sales excluding the 2012 and 2011 adjusted items, increased six basis points$443 million in 2012,2013. The decrease in interest expense in 2015, compared to 2011,2014, resulted primarily due to improvementsthe timing of debt principal payments and debt issuances, partially offset by an increase in operating, general and administrative expenses, rent and depreciation, as a percentage of sales, offset partially by continued investments in lower prices for our customers and increased shrink and warehousing costs, as a percentage of sales.
A-13
The following table provides a reconciliation of operating profit to FIFO operating profit and FIFO operating profit, excluding fuel and the adjusted items, for 2013, 2012 and 2011 ($ in millions):
| 2012 | ||||||||||||||||||||||||||||
| 2013 | 2012 | Adjusted | 2011 | |||||||||||||||||||||||||
| Percentage | Percentage | 2012 | Percentage | Percentage | ||||||||||||||||||||||||
| 2013 | of Sales | 2012 | of Sales | Adjusted (1) | of Sales | 2011 | of Sales | |||||||||||||||||||||
| Sales | $ | 98,375 | $ | 96,619 | $ | 94,661 | $ | 90,269 | ||||||||||||||||||||
| Fuel sales | (18,962 | ) | (18,896 | ) | (18,413 | ) | (16,901 | ) | ||||||||||||||||||||
| Sales excluding fuel | $ | 79,413 | $ | 77,723 | $ | 76,248 | $ | 73,368 | ||||||||||||||||||||
| Operating profit | $ | 2,725 | 2.77 | % | $ | 2,764 | 2.86 | % | $ | 2,664 | 2.81 | % | $ | 1,278 | 1.42 | % | ||||||||||||
| LIFO charge | 52 | 0.05 | % | 55 | 0.06 | % | 55 | 0.06 | % | 216 | 0.24 | % | ||||||||||||||||
| FIFO operating profit | 2,777 | 2.82 | % | 2,819 | 2.92 | % | 2,719 | 2.87 | % | 1,494 | 1.66 | % | ||||||||||||||||
| Fuel operating profit | (219 | ) | 1.15 | % | (218 | ) | 1.15 | % | (215 | ) | 1.17 | % | (192 | ) | 1.14 | % | ||||||||||||
| FIFO operating profit | ||||||||||||||||||||||||||||
| excluding fuel | 2,558 | 3.22 | % | 2,601 | 3.35 | % | 2,504 | 3.28 | % | 1,302 | 1.77 | % | ||||||||||||||||
| Adjusted items (2) | 16 | (115 | ) | (115 | ) | 953 | ||||||||||||||||||||||
| FIFO operating profit | ||||||||||||||||||||||||||||
| excluding fuel and the | ||||||||||||||||||||||||||||
| adjusted items | $ | 2,574 | 3.24 | % | $ | 2,486 | 3.20 | % | $ | 2,389 | 3.13 | % | $ | 2,255 | 3.07 | % | ||||||||||||
Percentages may not sum due to rounding.
Interest Expense
Net interest expense totaled $443 millionassociated with our commercial paper program. The increase in 2013, $462 million in 2012 and $435 million in 2011. Excluding the extra week, net interest expense was $454 million in 2012. The decrease in net interest expense in 2013,2014, compared to 2012, excluding the extra week,2013, resulted primarily from a lower weighted average interest rate, offset partially by a decrease in the net benefit from interest rate swaps. Thean increase in net interest expense in 2012 excluding the extra week, compared to 2011, resulted primarily from a decrease in the benefit from interest rate swaps and an increase in total debt, offset partially by a lower weighted average interest rate.primarily due to financing the merger with Harris Teeter and repurchases of our outstanding common shares.
Income Taxes
Our effective income tax rate was 33.8% in 2015, 34.1% in 2014 and 32.9% in 2013, 34.5% in 20122013. The 2015, 2014 and 29.3% in 2011. The 2013 tax rate differed from the federal statutory rate primarily as a result of the utilization of tax credits, the Domestic Manufacturing Deduction and other changes, partially offset by the effect of state income taxes. The 2012 tax rate differed from the federal statutory rate primarily as a result of the utilization of tax credits, the favorable resolution of certain tax issues and other changes, partially offset by the effect of state income taxes. The 2013 benefit from the Domestic Manufacturing Deduction increased from 2012 due to additional deductions taken in 2013, as well as the amendment of prior years’ tax returns to claim the additional benefit available in years still under review by the Internal Revenue Service. The 2011 effective tax rate differed from the federal statutory rate primarily as a result of the utilization of tax credits and the favorable resolution of certain tax issues, partially offset by the effect of state income taxes. The 2011 effective tax rate was also lower than 2013 and 2012 due to the effect on pre-tax income of the UFCW consolidated pension plan charge of $953 million ($591 million after-tax). Excluding the UFCW consolidated pension plan charge, our effective rate in 2011 would have been 33.9%.
A-14
Common Share Repurchase ProgramCOMMON SHARE REPURCHASE PROGRAMS
We maintain share repurchase programs that comply with Rule 10b5-1 of the Securities Exchange Act Rule 10b5-1of 1934 and allow for the orderly repurchase of our common shares, from time to time. We made open market purchases of Krogerour common shares totaling $500 million in 2015, $1.1 billion in 2014 and $338 million in 2013 $1.2 billion in 2012 and $1.4 billion in 2011 under these repurchase programs. In addition to these repurchase programs, we also repurchase common shares to reduce dilution resulting from our employee stock option plans. This program is solely funded by proceeds from stock option exercises, and the tax benefit from these exercises. We repurchased approximately $203 million in 2015, $155 million in 2014 and $271 million in 2013 $96 million in 2012 and $127 million in 2011 of Krogerour common shares under the stock option program.
The shares reacquiredrepurchased in 20132015 were acquired under two separate share repurchase programs. The first is a $500 million repurchase program that was authorized by Kroger’sour Board of Directors on October 16, 2012.June 26, 2014. The second is a program that uses the cash proceeds from the exercises of stock options by participants in Kroger’sour stock option and long-term incentive plans as well as the associated tax benefits. AsOn June 25, 2015, our Board of February 1, 2014, we had $129 million remaining on the October 16, 2012Directors approved a new $500 million share repurchase program to replace our prior authorization, which had been exhausted. As of January 30, 2016, we have not repurchased any shares utilizing the June 25, 2015 repurchase program. On March 13, 2014, the Company announced10, 2016, our Board of Directors approved a new $1 billion$500 million share repurchase program that was authorizedto supplement the 2015 Repurchase Program, which is expected to be exhausted by the Boardend of Directors, replacing the $500 million repurchase program that was authorized by the Boardsecond quarter of Directors on October 16, 2012.2016.
Capital InvestmentsCAPITAL INVESTMENTS
Capital investments, including changes in construction-in-progress payables and excluding acquisitionsmergers and the purchase of leased facilities, totaled $3.3 billion in 2015, $2.8 billion in 2014 and $2.3 billion in 2013, $2.0 billion in 2012 and $1.9 billion in 2011.2013. Capital investments for acquisitionsmergers totaled $168 million in 2015, $252 million in 2014 and $2.3 billion in 2013, $1222013. Payments for mergers of $168 million in 2012 and $512015, $252 million in 2011. Capital investments for acquisitions of2014 and $2.3 billion in 2013 relate to our mergermergers with Roundy’s, Vitacost.com and Harris Teeter.Teeter, respectively. Refer to Note 2 to the Consolidated Financial Statements for more information on the mergermergers with Roundy’s, Vitacost.com and Harris Teeter. Capital investments for the purchase of leased facilities totaled $35 million in 2015, $135 million in 2014 and $108 million in 2013, $73 million in 2012 and $60 million in 2011.2013. The table below shows our supermarket storing activity and our total food store square footage:
Supermarket Storing Activity
| 2013 | 2012 | 2011 | 2015 | 2014 | 2013 | |||||||||||||
| Beginning of year | 2,424 | 2,435 | 2,460 | 2,625 | 2,640 | 2,424 | ||||||||||||
| Opened | 17 | 18 | 10 | 31 | 33 | 17 | ||||||||||||
| Opened (relocation) | 7 | 7 | 12 | 12 | 13 | 7 | ||||||||||||
| Acquired | 227 | — | 6 | 159 | — | 227 | ||||||||||||
| Acquired (relocation) | — | — | 2 | |||||||||||||||
| Closed (operational) | (28 | ) | (29 | ) | (41 | ) | (37 | ) | (48 | ) | (28 | ) | ||||||
| Closed (relocation) | (7 | ) | (7 | ) | (14 | ) | (12 | ) | (13 | ) | (7 | ) | ||||||
| End of year | 2,640 | 2,424 | 2,435 | 2,778 | 2,625 | 2,640 | ||||||||||||
| Total food store square footage (in millions) | 161 | 149 | 149 | 173 | 162 | 161 | ||||||||||||
Return on Invested CapitalRETURN ON INVESTED CAPITAL
We calculate return on invested capital (“ROIC”) by dividing adjusted operating profit for the prior four quarters by the average invested capital. Adjusted operating profit is calculated by excluding certain items included in operating profit, and adding back our LIFO charge, depreciation and amortization and rent.rent to our U.S. GAAP operating profit of the prior four quarters. Average invested capital is calculated as the sum of (i) the average of our total assets, (ii) the average LIFO reserve, (iii) the average accumulated depreciation and amortization and (iv) a rent factor equal to total rent for the last four quarters multiplied by a factor of eight; minus (i) the average taxes receivable, (ii) the average trade accounts payable, (iii) the average accrued salaries and wages and (iv) the average other current liabilities.liabilities, excluding accrued income taxes. Averages are calculated for return on invested capitalROIC by adding the beginning balance of the first
A-15
quarter and the ending balance of the fourth quarter, of the last four quarters, and dividing by two. We use a factor of eight for our total rent as we believe this is a common factor used by our investors, analysts and analysts. Harris
A-15
Teeter’s invested capital has been excluded from the calculation in 2013 due to the timing of the merger and the immaterial effect on operations as compared to the average invested capital.rating agencies. ROIC is a non-GAAP financial measure of performance. ROIC should not be reviewed in isolation or considered as a substitute for our financial results as reported in accordance with GAAP. ROIC is an important measure used by management to evaluate our investment returns on capital. Management believes ROIC is a useful metric to investors and analysts because it measures how effectively we are deploying our assets. All items included in the calculation of ROIC are GAAP measures, excluding certain adjustments to operating income.
Although ROIC is a relatively standard financial term, numerous methods exist for calculating a company’s ROIC. As a result, the method used by our management to calculate ROIC may differ from methods other companies use to calculate their ROIC. We urge you to understand the methods used by other companies to calculate their ROIC before comparing our ROIC to that of such other companies.
The following table provides a calculation of ROIC for 20132015 and 2012 on a 52 week basis2014. The 2015 calculation of ROIC excludes the financial position, results and excludingmerger costs for the assets and liabilities recorded at year end for Harris Teeter ($ in millions):Roundy’s transaction:
| February 1, | February 2, | January 30, | January 31, | |||||||||||||||
| 2014 | 2013 | 2016 | 2015 | |||||||||||||||
| Return on Invested Capital | ||||||||||||||||||
| Numerator | ||||||||||||||||||
| Operating profit on a 53 week basis in fiscal year 2012 | $ | 2,725 | $ | 2,764 | ||||||||||||||
| 53rdweek operating profit adjustment | — | (100 | ) | |||||||||||||||
| Operating profit | $ | 3,576 | $ | 3,137 | ||||||||||||||
| LIFO charge | 52 | 55 | 28 | 147 | ||||||||||||||
| Depreciation | 1,703 | 1,652 | ||||||||||||||||
| Rent on a 53 week basis in fiscal year 2012 | 613 | 628 | ||||||||||||||||
| 53rdweek rent adjustment | — | (12 | ) | |||||||||||||||
| 2013 adjusted item | 16 | — | ||||||||||||||||
| 2012 adjusted items | — | (115 | ) | |||||||||||||||
| Depreciation and amortization | 2,089 | 1,948 | ||||||||||||||||
| Rent | 723 | 707 | ||||||||||||||||
| Adjustments for pension plan agreements | — | 87 | ||||||||||||||||
| Other | (13 | ) | — | |||||||||||||||
| Adjusted operating profit | $ | 5,109 | $ | 4,872 | $ | 6,403 | $ | 6,026 | ||||||||||
| Denominator | ||||||||||||||||||
| Average total assets | $ | 26,958 | $ | 24,044 | $ | 32,197 | $ | 29,860 | ||||||||||
| Average taxes receivable (1) | (10 | ) | (22 | ) | (206 | ) | (19 | ) | ||||||||||
| Average LIFO reserve | 1,124 | 1,071 | 1,259 | 1,197 | ||||||||||||||
| Average accumulated depreciation and amortization | 14,991 | 14,051 | 17,441 | 16,057 | ||||||||||||||
| Average trade accounts payable | (4,683 | ) | (4,382 | ) | (5,390 | ) | (4,967 | ) | ||||||||||
| Average accrued salaries and wages | (1,084 | ) | (1,061 | ) | (1,359 | ) | (1,221 | ) | ||||||||||
| Average other current liabilities (2) | (2,544 | ) | (2,314 | ) | (3,054 | ) | (2,780 | ) | ||||||||||
| Adjustment for Harris Teeter (3) | (1,618 | ) | — | |||||||||||||||
| Adjustment for Roundy’s merger | (714 | ) | — | |||||||||||||||
| Rent x 8 | 4,904 | 4,928 | 5,784 | 5,656 | ||||||||||||||
| Average invested capital | $ | 38,038 | $ | 36,315 | $ | 45,958 | $ | 43,783 | ||||||||||
| Return on Invested Capital | 13.43 | % | 13.42 | % | 13.93 | % | 13.76 | % | ||||||||||
| (1) | Taxes receivable were $392 as of January 30, 2016, $20 as of January 31, 2015 and $18 as of February 1, | |
| (2) | Other current liabilities included accrued income taxes of $5 as of January 31, 2015 and $92 as of February 1, | |
A-16
Critical Accounting PoliciesCRITICAL ACCOUNTING POLICIES
We have chosen accounting policies that we believe are appropriate to report accurately and fairly our operating results and financial position, and we apply those accounting policies in a consistent manner. Our significant accounting policies are summarized in Note 1 to the Consolidated Financial Statements.
The preparation of financial statements in conformity with GAAP requires us to make estimates and assumptions that affect the reported amounts of assets, liabilities, revenues, and expenses, and related disclosures of contingent assets and liabilities. We base our estimates on historical experience and other factors we believe to be reasonable under the circumstances, the results of which form the basis for making judgments about the carrying values of assets and liabilities that are not readily apparent from other sources. Actual results could differ from those estimates.
We believe that the following accounting policies are the most critical in the preparation of our financial statements because they involve the most difficult, subjective or complex judgments about the effect of matters that are inherently uncertain.
Self-Insurance Costs
We primarily are self-insured for costs related to workers’ compensation and general liability claims. The liabilities represent our best estimate, using generally accepted actuarial reserving methods, of the ultimate obligations for reported claims plus those incurred but not reported for all claims incurred through February 1, 2014.January 30, 2016. We establish case reserves for reported claims using case-basis evaluation of the underlying claim data and we update as information becomes known.
For both workers’ compensation and general liability claims, we have purchased stop-loss coverage to limit our exposure to any significant exposure on a per claim basis. We are insured for covered costs in excess of these per claim limits. We account for the liabilities for workers’ compensation claims on a present value basis utilizing a risk-adjusted discount rate. A 25 basis point decrease in our discount rate would increase our liability by approximately $2 million. General liability claims are not discounted.
The assumptions underlying the ultimate costs of existing claim losses are subject to a high degree of unpredictability, which can affect the liability recorded for such claims. For example, variability in inflation rates of health care costs inherent in these claims can affect the amounts realized. Similarly, changes in legal trends and interpretations, as well as a change in the nature and method of how claims are settled can affect ultimate costs. Our estimates of liabilities incurred do not anticipate significant changes in historical trends for these variables, and any changes could have a considerable effect on future claim costs and currently recorded liabilities.
Impairments of Long-Lived Assets
We monitor the carrying value of long-lived assets for potential impairment each quarter based on whether certain triggertriggering events have occurred. These events include current period losses combined with a history of losses or a projection of continuing losses or a significant decrease in the market value of an asset. When a triggertriggering event occurs, we perform an impairment calculation, comparing projected undiscounted cash flows, utilizing current cash flow information and expected growth rates related to specific stores, to the carrying value for those stores. If we identify impairment for long-lived assets to be held and used, we compare the assets’ current carrying value to the assets’ fair value. Fair value is determined based on market values or discounted future cash flows. We record impairment when the carrying value exceeds fair market value. With respect to owned property and equipment held for disposal, we adjust the value of the property and equipment to reflect recoverable values based on our previous efforts to dispose of similar assets and current economic conditions. We recognize impairment for the excess of the carrying value over the estimated fair market value, reduced by estimated direct costs of disposal. We recorded asset impairments in the normal course of business totaling $46 million in 2015, $37 million in 2014 and $39 million in 2013, $18 million in 2012 and $37 million in 2011.2013. We record costs to reduce the carrying value of long-lived assets in the Consolidated Statements of Operations as “Operating, general and administrative” expense.
A-17
The factors that most significantly affect the impairment calculation are our estimates of future cash flows. Our cash flow projections look several years into the future and include assumptions on variables such as inflation, the economy and market competition. Application of alternative assumptions and definitions, such as reviewing long-lived assets for impairment at a different level, could produce significantly different results.
Goodwill
Our goodwill totaled $2.1$2.7 billion as of February 1, 2014.January 30, 2016. We review goodwill for impairment in the fourth quarter of each year, and also upon the occurrence of triggering events. We perform reviews of each of our operating divisions and variable interest entities (collectively, our reporting units)“reporting units”) that have goodwill balances. Fair value is determined using a multiple of earnings, or discounted projected future cash flows, and we compare fair value to the carrying value of a reporting unit for purposes of identifying potential impairment. We base projected future cash flows on management’s knowledge of the current operating environment and expectations for the future. If we identify potential for impairment, we measure the fair value of a reporting unit against the fair value of its underlying assets and liabilities, excluding goodwill, to estimate an implied fair value of the division’sreporting unit’s goodwill. We recognize goodwill impairment for any excess of the carrying value of the division’sreporting unit’s goodwill over the implied fair value.
In 2013,2015, goodwill increased $901$420 million primarily due to our merger with Harris Teeter which closed on January 28, 2014.Roundy’s. In 2014, goodwill increased $169 million primarily due to our merger with Vitacost.com. For additional information related to the allocation of the Harris Teeter purchase price for Roundy’s and Vitacost.com, refer to Note 2 to the Consolidated Financial Statements.
The annual evaluation of goodwill performed for our other reporting units during the fourth quarter of 2013, 20122015, 2014 and 20112013 did not result in impairment. Based on current and future expected cash flows, we believe goodwill impairments are not reasonably likely. A 10% reduction in fair value of our reporting units would not indicate a potential for impairment of our goodwill balance.
For additional information relating to our results of the goodwill impairment reviews performed during 2013, 20122015, 2014 and 20112013 see Note 3 to the Consolidated Financial Statements.
The impairment review requires the extensive use of management judgment and financial estimates. Application of alternative estimates and assumptions, such as reviewing goodwill for impairment at a different level, could produce significantly different results. The cash flow projections embedded in our goodwill impairment reviews can be affected by several factors such as inflation, business valuations in the market, the economy and market competition.
Store Closing Costs
We provide for closed store liabilities on the basis of the present value of the estimated remaining non-cancellable lease payments after the closing date, net of estimated subtenant income. We estimate the net lease liabilities using a discount rate to calculate the present value of the remaining net rent payments on closed stores. We usually pay closed store lease liabilities over the lease terms associated with the closed stores, which generally have remaining terms ranging from one to 20 years. Adjustments to closed store liabilities primarily relate to changes in subtenant income and actual exit costs differing from original estimates. We make adjustments for changes in estimates in the period in which the change becomes known. We review store closing liabilities quarterly to ensure that any accrued amount that is not a sufficient estimate of future costs or that no longer is needed for its originally intended purpose, is adjusted to earnings in the proper period.
We estimate subtenant income, future cash flows and asset recovery values based on our experience and knowledge of the market in which the closed store is located, our previous efforts to dispose of similar assets and current economic conditions. The ultimate cost of the disposition of the leases and the related assets is affected by current real estate markets, inflation rates and general economic conditions.
A-18
We reduce owned stores held for disposal to their estimated net realizable value. We account for costs to reduce the carrying values of property, equipment and leasehold improvements in accordance with our policy on impairment of long-lived assets. We classify inventory write-downs in connection with store closings, if any, in “Merchandise costs.” We expense costs to transfer inventory and equipment from closed stores as they are incurred.
A-18
Post-Retirement Benefit Plans
We account for our defined benefit pension plans using the recognition and disclosure provisions of GAAP, which require the recognition of the funded status of retirement plans on the Consolidated Balance Sheet. We record, as a component of Accumulated Other Comprehensive Income (“AOCI”), actuarial gains or losses, prior service costs or credits and transition obligations that have not yet been recognized.
The determination of our obligation and expense for Company-sponsored pension plans and other post-retirement benefits is dependent upon our selection of assumptions used by actuaries in calculating those amounts. Those assumptions are described in Note 15 to the Consolidated Financial Statements and include, among others, the discount rate, the expected long-term rate of return on plan assets, average life expectancymortality and the rate of increases in compensation and health care costs. Actual results that differ from our assumptions are accumulated and amortized over future periods and, therefore, generally affect our recognized expense and recorded obligation in future periods. While we believe that our assumptions are appropriate, significant differences in our actual experience or significant changes in our assumptions, including the discount rate used and the expected return on plan assets, may materially affect our pension and other post-retirement obligations and our future expense. Note 15 to the Consolidated Financial Statements discusses the effect of a 1% change in the assumed health care cost trend rate on other post-retirement benefit costs and the related liability.
The objective of our discount rate assumptions was intended to reflect the rates at which the pension benefits could be effectively settled. In making this determination, we take into account the timing and amount of benefits that would be available under the plans. Our methodology for selecting the discount rates as of year-end 2013 and 2012 was to match the plan’s cash flows to that of a hypothetical bond portfolio whose cash flow from coupons and maturities match the plan’s projected benefit cash flows. The discount rates are the single rates that produce the same present value of cash flows. The selection of the 4.99%4.62% and 4.68%4.44% discount rates as of year-end 20132015 for pension and other benefits, respectively, represents the hypothetical bond portfolio using bonds with an AA or better rating constructed with the assistance of an outside consultant. We utilized a discount rate of 4.29%3.87% and 4.11%3.74% as of year-end 20122014 for pension and other benefits, respectively. A 100 basis point increase in the discount rate would decrease the projected pension benefit obligation as of February 1, 2014,January 30, 2016, by approximately $395.$438 million.
To determine the expected rate of return on pension plan assets held by Kroger for 2013,2015, we considered current and forecasted plan asset allocations as well as historical and forecasted rates of return on various asset categories. Due to the Harris Teeter merger occurring close to year end, the expected rate of return on pension plan assets acquired in the Harris Teeter merger did not affectIn 2015, our net periodic benefit cost in 2013. For 2013 and 2012, we assumed a pension plan investment return rate of 8.5%.was 7.44%, compared to 7.44% in 2014 and 8.50 in 2013. Our pension plan’splans’ average rate of return was 8.1%6.47% for the 10 calendar years ended December 31, 2013,2015, net of all investment management fees and expenses. The value of all investments in our Company-sponsored defined benefit pension plans excluding pension plan assets acquired in the Harris Teeter merger, during the calendar year ending December 31, 2013,2015, net of investment management fees and expenses, increased 8.0%decreased 0.80%. For the past 20 years, our average annual rate of return has been 9.2%7.99%. Based on the above information and forward looking assumptions for investments made in a manner consistent with our target allocations, we believe an 8.5%a 7.44% rate of return assumption wasis reasonable for 2013 and 2012.2015. See Note 15 to the Consolidated Financial Statements for more information on the asset allocations of pension plan assets.
On January 31, 2015, we adopted new mortality tables, including industry-based tables for annuitants, reflecting more current mortality experience and assumptions for future generational mortality improvement in calculating our projected benefit obligations as of January 30, 2016 and January 31, 2015 and our 2015 pension expense. The tables assume an improvement in life expectancy and increased our benefit obligation and future expenses. We used the RP-2000 projected to 2021 mortality table in calculating our 2013 year end pension obligation and 2014 and 2013 pension expense.
A-19
Sensitivity to changes in the major assumptions used in the calculation of Kroger’s pension plan liabilities is illustrated below (in millions).
| Projected | ||||||||||||||
| Benefit | ||||||||||||||
| Percentage | Obligation | Expense | ||||||||||||
| Point | Decrease/ | Decrease/ | ||||||||||||
| Change | (Increase) | (Increase) | ||||||||||||
| Discount Rate | +/- | ) | $36/($ | |||||||||||
| Expected Return on Assets | +/- | — | $ | |||||||||||
A-19
WeIn 2015, we contributed $100$5 million in 2013, $71 million in 2012 and $52 million in 2011 to our Company-sponsored defined benefit pension plans. Weplans and do not expect to make any contributions to these plans in 2016. In 2014, we did not contribute to our Company-sponsored defined benefit plans and do not expect to make any contributions to this plan in 2015. We did not make a contribution in 2014 and contributed $100 million in 2013 to our Company-sponsored defined benefit pension plans in 2014.plans. Among other things, investment performance of plan assets, the interest rates required to be used to calculate the pension obligations, and future changes in legislation, will determine the amounts of contributions.
We contributed and expensed $196 million in 2015, $177 million in 2014 and $148 million in 2013 $140 million in 2012 and $130 million in 2011 to employee 401(k) retirement savings accounts. The increase in 2015, compared to 2014, is due to a higher employee savings rate. The increase in 2014, compared to 2013, is due to the effect of our merger with Harris Teeter. The 401(k) retirement savings account plans provide to eligible employees both matching contributions and automatic contributions from the Company based on participant contributions, plan compensation, and length of service.
Multi-Employer Pension Plans
We also contribute to various multi-employer pension plans, including the UFCW Consolidated Pension Plan, based on obligations arising from collective bargaining agreements. We are designated as the named fiduciary of the UFCW Consolidated Pension Plan and have sole investment authority over these assets. These multi-employer pension plans provide retirement benefits to participants based on their service to contributing employers. The benefits are paid from assets held in trust for that purpose. Trustees are appointed in equal number by employers and unions. The trustees typically are responsible for determining the level of benefits to be provided to participants as well as for such matters as the investment of the assets and the administration of the plans.
In the fourth quarter of 2011, we entered into a memorandum of understanding (“MOU”) with 14 locals of the UFCW that participated in four multi-employer pension funds. The MOU established a process that amended each of the collective bargaining agreements between Kroger and the UFCW locals under which we made contributions to these funds and consolidated the four multi-employer pension funds into one multi-employer pension fund.
Under the terms of the MOU, the locals of the UFCW agreed to a future pension benefit formula through 2021. We are designated as the named fiduciary of the new consolidated pension plan with sole investment authority over the assets. We committed to contribute sufficient funds to cover the actuarial cost of current accruals and to fund the pre-consolidation Unfunded Actuarial Accrued Liability (“UAAL”) that existed as of December 31, 2011, in a series of installments on or before March 31, 2018. At January 1, 2012, the UAAL was estimated to be $911 million (pre-tax). In accordance with GAAP, we expensed $911 million in 2011 related to the UAAL. The expense was based on a preliminary estimate of the contractual commitment. In 2012, we finalized the UAAL contractual commitment and recorded an adjustment that reduced our 2011 estimated commitment by $53 million (pre-tax). The final UAAL contractual commitment, at January 1, 2012, was $858 million (pre-tax). In the fourth quarter of 2011,2015, we contributed $650$190 million to the consolidated multi-employerUFCW Consolidated Pension Plan. We had previously accrued $60 million of the total contributions at January 31, 2015 and recorded expense for the remaining $130 million at the time of payment in 2015. In 2014, we incurred a charge of $56 million (after-tax) related to commitments and withdrawal liabilities associated with the restructuring of pension plan agreements, of which $600$15 million was allocatedcontributed to the UAAL and $50 million was allocatedUFCW Consolidated Pension Plan in 2014. As of January 30, 2016, we are not required to service and interest costs and expensed in 2011. In the fourth quarter of 2012, we contributed $258 millioncontribute to the consolidated multi-employer pension plan to fully fund our UAAL contractual commitment. Future contributions will be dependent, among other things, on the investment performance of assetsUFCW Consolidated Pension Plan in the plan. The funding commitments under the MOU replace the prior commitments under the four existing funds to pay an agreed upon amount per hour worked by eligible employees.2016.
We recognize expense in connection with these plans as contributions are funded or in the case of the UFCW consolidated pension plan, when commitments are made, in accordance with GAAP. We made cash contributions to these plans of $426 million in 2015, $297 million in 2014 and $228 million in 2013, $492 million in 2012 and $946 million in 2011. The cash contributions for 2012 and 2011 include our $258 million contribution in 2012 and our $650 million contribution in 2011 to the UFCW consolidated pension plan in the fourth quarter of each year.2013.
Based on the most recent information available to us, we believe that the present value of actuarially accrued liabilities in most of the multi-employer plans to which we contribute substantially exceeds the value of the assets held in trust to pay benefits. We have attempted to estimate the amount by which these liabilities exceed the assets, (i.e., the amount of underfunding), as of December 31, 2013.2015. Because Kroger iswe are only one of a number of employers contributing to these plans, we also have attempted to estimate the ratio of Kroger’sour contributions to the total of all contributions to these plans in a year as a way of assessing Kroger’sour “share” of the underfunding. Nonetheless, the underfunding is not a direct obligation or liability of Krogerours or of any employer except as noted above.employer. As of December 31, 2013,2015, we estimate that Kroger’sour share of the underfunding of multi-employer plans to which we contribute was approximately $2.9 billion, pre-tax, or
A-20
$1.8 billion, after-tax, which includes Roundy’s share of underfunding of its multi-employer plans to which Kroger contributes was $1.6 billion, pre-tax, or $1.0 billion, after-tax.plans. This represents a decreasean increase in the estimated amount of underfunding of approximately $150 million,$1.1 billion, pre-tax, or $95approximately $680 million, after-tax, as of December 31, 2013,2015, compared to December 31, 2012.2014. The decreaseincrease in the amount of underfunding is attributable to the increasedlower than expected returns on the assets held in the multi-employer plans during 2013.2015, changes in mortality rate assumptions and the merger of Roundy’s. Our estimate is based on the most current information available to us including actuarial evaluations and other data (that include the estimates of others), and such information may be outdated or otherwise unreliable.
We have made and disclosed this estimate not because, except as noted above, this underfunding is a direct liability of Kroger.ours. Rather, we believe the underfunding is likely to have important consequences. In 2013, excluding all payments to the UFCW consolidated pension plan and the pension plans that were consolidated into the UFCW consolidated pension plan, our contributions to these plans increased approximately 5% over the prior year and have grown at a compound annual rate of approximately 8% since 2008. In 2014,2016, we expect to contribute approximately $250$260 million to multi-employer pension plans, subject to collective bargaining and capital market conditions. Excluding all payments to the UFCW consolidated pension plan and the pension plans that were consolidated into the UFCW consolidated pension plan, based on current market conditions, weWe expect increases in expense as a result of increases in multi-employer pension plan contributions over the next few years. Finally, underfunding means that, in the event we were to exit certain markets or otherwise cease making contributions to these funds, we could trigger a substantial withdrawal liability. Any adjustment for withdrawal liability will be recorded when it is probable that a liability exists and can be reasonably estimated, in accordance with GAAP.
The amount of underfunding described above is an estimate and could change based on contract negotiations, returns on the assets held in the multi-employer plans and benefit payments. The amount could decline, and Kroger’sour future expense would be favorably affected, if the values of the assets held in the trust significantly increase or if further changes occur through collective bargaining, trustee action or favorable legislation. On the other hand, Kroger’sour share of the underfunding could increase and Kroger’sour future expense could be adversely affected if the asset values decline, if employers currently contributing to these funds cease participation or if changes occur through collective bargaining, trustee action or adverse legislation. The Company continuesWe continue to evaluate our potential exposure to under-funded multi-employer pension plans. Although these liabilities are not a direct obligation or liability of Kroger,ours, any commitments to fund certain multi-employer plans will be expensed when our commitment is probable and an estimate can be made.
See Note 16 to the Consolidated Financial Statements for more information relating to our participation in these multi-employer pension plans.
Deferred Rent
We recognize rent holidays, including the time period during which we have access to the property for construction of buildings or improvements, as well as construction allowances and escalating rent provisions on a straight-line basis over the term of the lease. The deferred amount is included in Other Current Liabilities and Other Long-Term Liabilities on the Consolidated Balance Sheets.
Uncertain Tax Positions
We review the tax positions taken or expected to be taken on tax returns to determine whether and to what extent a benefit can be recognized in our consolidated financial statements.Consolidated Financial Statements. Refer to Note 5 to the Consolidated Financial Statements for the amount of unrecognized tax benefits and other related disclosures related to uncertain tax positions.
Various taxing authorities periodically audit our income tax returns. These audits include questions regarding our tax filing positions, including the timing and amount of deductions and the allocation of income to various tax jurisdictions. In evaluating the exposures connected with these various tax filing positions, including state and local taxes, we record allowances for probable exposures. A number of years may elapse before a particular matter, for which an allowance has been established, is audited and fully resolved. As of
A-21
February 1, 2014, January 30, 2016, the Internal Revenue Service had concluded its field examination of our 20082010 and 20092011 federal tax returns. We have filed an administrative appeal with the Internal Revenue Service protesting certain adjustments proposed by the Internal Revenue Service as a result of their field work.Tax years 2012 and 2013 remain under examination.
The assessment of our tax position relies on the judgment of management to estimate the exposures associated with our various filing positions.
Share-Based Compensation Expense
We account for stock options under the fair value recognition provisions of GAAP. Under this method, we recognize compensation expense for all share-based payments granted. We recognize share-based compensation expense, net of an estimated forfeiture rate, over the requisite service period of the award. In addition, we record expense for restricted stock awards in an amount equal to the fair market value of the underlying stock on the grant date of the award, over the period the award restrictions lapse.
A-21
Inventories
Inventories are stated at the lower of cost (principally on a LIFO basis) or market. In total, approximately 95% of inventories in 20132015 and 96% of inventories in 20122014 were valued using the LIFO method. Cost for the balance of the inventories, including substantially all fuel inventories, was determined using the FIFO method. Replacement cost was higher than the carrying amount by $1.2$1.3 billion at February 1, 2014January 30, 2016 and by $1.1 billion at February 2, 2013.January 31, 2015. We follow the Link-Chain, Dollar-Value LIFO method for purposes of calculating our LIFO charge or credit.
We follow the item-cost method of accounting to determine inventory cost before the LIFO adjustment for substantially all store inventories at our supermarket divisions. This method involves counting each item in inventory, assigning costs to each of these items based on the actual purchase costs (net of vendor allowances and cash discounts) of each item and recording the cost of items sold. The item-cost method of accounting allows for more accurate reporting of periodic inventory balances and enables management to more precisely manage inventory. In addition, substantially all of our inventory consists of finished goods and is recorded at actual purchase costs (net of vendor allowances and cash discounts).
We evaluate inventory shortages throughout the year based on actual physical counts in our facilities. We record allowances for inventory shortages based on the results of recent physical counts to provide for estimated shortages from the last physical count to the financial statement date.
Vendor Allowances
We recognize all vendor allowances as a reduction in merchandise costs when the related product is sold. In most cases, vendor allowances are applied to the related product cost by item, and therefore reduce the carrying value of inventory by item. When it is not practicable to allocate vendor allowances to the product by item, we recognize vendor allowances as a reduction in merchandise costs based on inventory turns and as the product is sold. We recognized approximately $7.3 billion in 2015, $6.9 billion in 2014 and $6.2 billion in 2013 and 2012 and $5.9 billion in 2011 of vendor allowances as a reduction in merchandise costs. We recognized approximately 94%91% of all vendor allowances in the item cost with the remainder being based on inventory turns.
Recently AdoptedRECENTLY ADOPTED ACCOUNTING STANDARDS
In 2015, the Financial Accounting Standards
In February 2013, Board (“FASB”) amended Accounting Standards Codification 835, “Interest-Imputation of Interest.” The amendment simplifies the FASB amended its standards on comprehensive incomepresentation of debt issuance costs related to a recognized debt liability by requiring disclosure of information about amounts reclassified out of accumulated other comprehensive income (“AOCI”) by component. Specifically, the amendment requires disclosure of the effect of significant reclassifications out of AOCI on the respective line items in net income in which the item was reclassified if the amount being reclassified is required toit be reclassified to net income in its entiretypresented in the same reporting period. It requires cross reference to other disclosuresbalance sheet as a direct deduction from the carrying amount of that provide additional detail for amounts that are not required to be reclassified in their entirety in the same reporting period.debt liability, consistent with debt discounts. This new disclosureamendment became effective for us beginning February 3, 2013,1, 2015, and is beingwas adopted prospectivelyretrospectively in accordance with the standard. See Note 9The adoption of this amendment resulted in amounts previously reported in other assets to now be reported within long-term debt including obligations under capital leases and financing obligations in the Consolidated Balance Sheets. These amounts were not material to the Company’sprior year. The adoption of this amendment did not have an effect on our Consolidated Statements of Operations.
RECENTLY ISSUED ACCOUNTING STANDARDS
In May 2014, the FASB issued Accounting Standards Update (“ASU”) 2014-09, “Revenue from Contracts with Customers,” which provides guidance for revenue recognition. The standard’s core principle is that a company will recognize revenue when it transfers promised goods or services to customers in an amount that reflects the consideration to which the company expects to be entitled in exchange for those goods or services. Per ASU 2015-14, “Deferral of Effective Date,” this guidance will be effective for us in the first quarter of our fiscal year ending February 2, 2019. Early adoption is permitted as of the first quarter of our fiscal year ending February 3, 2018. We are currently in the process of evaluating the effect of adoption of this ASU on our Consolidated Financial Statements for the Company’s new disclosures related to this amended standard.Statements.
A-22
In December 2011,April 2015, the FASB amended its standards relatedissued ASU 2015-04, “Retirement Benefits (Topic 715): Practical Expedient for the Measurement Date of an Employer’s Defined Benefit Obligation and Plan Assets.” This amendment permits an entity to offsettingmeasure defined benefit plan assets and liabilities. This amendment requires entities to disclose both gross and net information about certain instruments and transactions eligible for offset inobligations using the statement of financial position and certain instruments and transactions subject to an agreement similar to a master netting agreement. This informationmonth end that is intended to enable users of the financial statements to understand the effect of these arrangements on our financial position. The new rules became effective for us on February 3, 2013. In January 2013, the FASB further amended this standard to limit its scope to derivatives, repurchase and reverse repurchase agreements, securities borrowings and lending transactions. See Note 7closest to the Company’s Consolidated Financial Statementsentity’s fiscal year end for the Company’s new disclosures related to this amended standard.
Recently Issued Accounting Standards
In July 2013, the FASB amended Accounting Standards Codification (“ASC”) 740, “Income Taxes.” The amendments provideall plans. This guidance on the financial statement presentation of an unrecognized tax benefit, as either a reduction of a deferred tax asset or as a liability, when a net operating loss carryforward, similar tax loss, or a tax credit carryforward exists. The amendments will be effective for interimus in the fiscal year ending January 28, 2017. The implementation of this amendment will not have an effect on our Consolidated Statements of Operations, and annual periods beginning after December 15, 2013will not have a significant effect on our Consolidated Balance Sheets.
In April 2015, the FASB issued ASU 2015-07, “Fair Value Measurement (Topic 820): Disclosures for Investments in Certain Entities That Calculate Net Asset Value per Share (or Its Equivalent).” This amendment removes the requirement to categorize within the fair value hierarchy all investments for which fair value is measured using the net asset value per share. This guidance will be effective for us in the fiscal year ending January 28, 2017. The implementation of this amendment will have an effect on our Notes to the Consolidated Financial Statements and maywill not have an effect on our Consolidated Statements of Operations or Consolidated Balance Sheets.
In September 2015, the FASB issued ASU 2015-16, “Business Combinations (Topic 805): Simplifying the Accounting for Measurement-Period Adjustments.” This amendment eliminates the requirement to retrospectively account for adjustments made to provisional amounts recognized in a business combination. This guidance will be applied on a retrospective basis. Early adoptioneffective for us in the fiscal year ending January 28, 2017. The implementation of this amendment is permitted. We do not expect the adoption of these amendmentsexpected to have a significant effect on our consolidatedConsolidated Financial Statements.
In November 2015, the FASB issued ASU 2015-17, “Income Taxes (Topic 740): Balance Sheet Classification of Deferred Taxes.” This amendment requires deferred tax liabilities and assets be classified as noncurrent in a classified statement of financial position or resultsposition. This guidance will be effective for our fiscal year ending January 28, 2017. Early adoption is permitted. The implementation of operations.this amendment will not have an effect on our Consolidated Statements of Operations and will not have a significant effect on our Consolidated Balance Sheets.
In February 2016, the FASB issued ASU 2016-02, “Leases”, which provides guidance for the recognition of lease agreements. The standard’s core principle is that a company will now recognize most leases on its balance sheet as lease liabilities with corresponding right-of-use assets. This guidance will be effective for us in the first quarter of fiscal year ending February 1, 2020. Early adoption is permitted. The adoption of this ASU will result in a significant increase to our Consolidated Balance Sheets for lease liabilities and right-of-use assets, and we are currently evaluating the other effects of adoption of this ASU on our Consolidated Financial Statements. We believe our current off-balance sheet leasing commitments are reflected in our investment grade debt rating.
Liquidity and Capital ResourcesLIQUIDITY AND CAPITAL RESOURCES
Cash Flow Information
Net cash provided by operating activities
We generated $3.4$4.8 billion of cash from operations in 2013,2015, compared to $2.8$4.2 billion in 20122014 and $2.7$3.6 billion in 2011.2013. The cash provided by operating activities came from net earnings including non-controlling interests adjusted primarily for non-cash expenses of depreciation and amortization, stock compensation, expense for Company-sponsored pension plans, the LIFO charge and changes in working capital.
The increase in net cash provided by operating activities in 2013,2015, compared to 2012, resulted primarily due to changes in working capital and long-term liabilities. The increase in net cash provided by operating activities in 2012, compared to 2011,2014, resulted primarily due to an increase in net earnings including non-controlling interests, offset by a declinean increase in long-term liabilitiesnon-cash items and changes in working capital.
The use of cash for the payment of long-term liabilities decreasedincrease in 2013,non-cash items in 2015, as compared to 2012, primarily due to our funding of the remaining UAAL in 2012. The use of cash increased in 2012, as compared to 2011, primarily due to our funding of the remaining UAAL commitment. Changes in working capital used cash from operating activities of $130 million in 2013, compared to $332 million in 2012 and $300 million in 2011. The decreased use of cash for changes in working capital in 2013, compared to 2012,2014, was primarily due to increases in depreciation and amortization expense and expense for Company-sponsored pension plans, partially offset by a decreaselower LIFO charge.
A-23
The increase in deposits in-transitnet cash provided by operating activities in 2014, compared to 2013, resulted primarily due to an increase in net earnings including non-controlling interests, which include the results of Harris Teeter, an increase in non-cash items, a reduction in contributions to Company-sponsored pension plans and a reduced use of cash for prepaid expenses and receivables. The increased use of cash for changes in working capitalcapital. The increase in 2012,non-cash items in 2014, as compared to 2011,2013, was primarily due to an increased use of cash for prepaid expensesincreases in depreciation and less cash provided by accrued expenses, partially offset by a reduced use of cash for inventories. Cash used for prepaid expenses increased in 2012, compared to 2011, due to Kroger prefunding $250 million of employee benefits atamortization expense and the end of 2012. These amounts are also net of cash contributions to our Company-sponsored defined benefit pension plans totaling $100 million in 2013, $71 million in 2012 and $52 million in 2011.
LIFO charge. The amount of cash paid for income taxes increased in 2013,2014, compared to 2012, primarily due to additional deductions taken in 2012 related to the funding of our pension contributions and union health benefits. The amount of cash paid for income taxes increased in 2012, compared to 2011,2013, primarily due to an increase in net earnings including non-controlling interests.
A-23Cash provided (used) by operating activities for changes in working capital was $96 million in 2015, compared to ($49) million in 2014 and $63 million in 2013. The increase in cash provided by operating activities for changes in working capital in 2015, compared to 2014, was primarily due to an increase in cash provided by trade accounts payables and store deposits in transit, partially offset by a decrease in cash provided by income taxes receivable and payable. The increase in cash used by operating activities for changes in working capital in 2014, compared to 2013, was primarily due to an increase in cash used for receivables and a decrease in cash provided by trade accounts payables, partially offset by an increase in cash provided by accrued expenses.
Net cash used by investing activities
Cash used by investing activities was $3.6 billion in 2015, compared to $3.1 billion in 2014 and $4.8 billion in 2013, compared to $2.2 billion in 2012 and $1.9 billion in 2011.2013. The amount of cash used by investing activities increased in 2013,2015, compared to 2012,2014, due to increased payments for capital investments, and acquisitions.partially offset by lower payments for mergers. The amount of cash used by investing activities increaseddecreased in 2012,2014, compared to 2011,2013, due to decreased payments for mergers, offset primarily by increased payments for capital investments and acquisitions.investments. Capital investments, including changes in construction-in-progress payables andpayments for lease buyouts, but excluding acquisitions,mergers, were $2.4$3.3 billion in 2013, $2.12015, $2.8 billion in 20122014 and $2.0 billion in 2011. Acquisitions were $2.3 billion in 2013, $1222013. Merger payments were $168 million in 2012 and $512015, $252 million in 2011. The increase2014 and $2.3 billion in 2013. Merger payments for acquisitionsdecreased in 2013,2014, compared to 2012 was2013, primarily due to our merger with Harris Teeter.Teeter in 2013. Refer to the “Capital Investments” section for an overview of our supermarket storing activity during the last three years.
Net cash usedprovided (used) by financing activities
Financing activities (used) provided (used) cash of $1.6($1.3) billion in 2013,2015, ($600) million in 2012 and ($1.4)1.2) billion in 2011.2014 and $1.4 billion in 2013. The increase in cash provided by financing activities in 2013, compared to 2012, was primarily related to increased proceeds from the issuance of long-term debt, primarily to finance our merger with Harris Teeter, and a reduction in payments on long-term debt and treasury stock purchases, offset partially by net payments on our commercial paper program. The decrease in the amount of cash used for financing activities in 2012,2015, compared to 2011,2014, was primarily related to increased payments on long-term debt and commercial paper, partially offset by higher proceeds from issuances of long-term debt and decreased treasury stock purchases. The increase in the amount of cash used for financing activities in 2014, compared to 2013, was primarily related to decreased proceeds from the issuance of long-term debt and net borrowings from our commercial paper program,increased treasury stock purchases, offset partially by decreased payments on long-term debt. Proceeds from the issuance of long-term debt were $1.2 billion in 2015, $576 million in 2014 and $3.5 billion in 2013, $863 million in 2012 and $453 million in 2011. Proceeds2013. Net (payments) borrowings provided from our commercial paper program were ($285) million in 2015, $25 million in 2014 and ($395) million in 2013, $1.3 billion in 2012 and $370 million in 2011.2013. Please refer to the “Debt Management” section of MD&A for additional information. We repurchased $609$703 million of Kroger common shares in 2013,2015, compared to $1.3 billion in 20122014 and $1.5 billion$609 million in 2011.2013. We paid dividends totaling $385 million in 2015, $338 million in 2014 and $319 million in 2013, $267 million in 2012 and $257 million in 2011.2013.
Debt Management
Total debt, including both the current and long-term portions of capital lease and lease-financing obligations, increased $2.4 billion$481 million to $11.3$12.1 billion as of year-end 2013,2015, compared to 2012.2014. The increase in 2013,2015, compared to 2012,2014, resulted primarily from the issuance of (i) $600$300 million of senior notes bearing an interest rate of 3.85%2.00%, (ii) $400$300 million of senior notes bearing an interest rate of 5.15%2.60%, (iii) $500 million of senior notes bearing an interest rate of 3-month London Inter-Bank Offering Rate (“LIBOR”) plus 53 basis points,3.50% and (iv) $300an increase in capital lease obligations due to our merger with Roundy’s and various leased locations, partially offset by payments of $678 million on long-term debt obligations assumed as part of our merger with Roundy’s and $500 million of payments at maturity of senior notes bearing an interest rate of 1.2%, (v) $500 million of senior notes bearing an interest rate of 2.3%, (vi) $700 million of senior notes bearing an interest rate of 3.3%, and (vii) $500 million of senior notes bearing an interest rate of 4.0%, offset partially by a reduction in commercial paper of $395 million and payments at maturity of $400 million of senior notes bearing an interest rate of 5.0% and $600 million of senior notes bearing an interest rate of 7.5%3.90%. ThisThe increase in financing obligations was due to partially funding our merger with Harris Teeter, refinancing our debt maturities in 2013 and replacing the senior notes that matured in fourth quarter of 2012, offset partially by the payment at maturity of our $400 million of senior notes bearing an interest rate of 5.0%, $600 million of senior notes bearing an interest rate of 7.5% and a reduction in commercial paper of $395 million.Roundy’s.
A-24
Total debt, including both the current and long-term portions of capital leaseslease and lease-financing obligations increased $714$346 million to $8.9$11.7 billion as of year-end 2012,2014, compared to 2011.2013. The increase in 2012,2014, compared to 2011,2013, resulted primarily from increased borrowings of $1.3 billion of commercial paper supported by our credit facility and(i) the issuance of (i) $500 million of senior notes bearing an interest rate of 3.4%2.95% and (ii) $350an increase in commercial paper of $25 million, partially offset by payments at maturity of $300 million of senior notes bearing an interest rate of 5.0%, offset partially by payments at maturity of (i) $491 million of senior notes bearing an interest rate of 6.75%, (ii) $346 million of senior notes bearing an interest rate of 6.2% and (iii) $500 million of senior notes bearing an interest rate of 5.5%4.95%. ThisThe increase in financing obligations was primarilydue to fundpartially funding our $258 million UFCW consolidated pension plan contribution in the fourth quarter of 2012, prefunding $250 million of employee benefit costs at the end of 2012, to repurchaseoutstanding common shares, pay at maturity $500 million of senior notes bearing an interest rate of 5.5% and purchase of a specialty pharmacy.share repurchases.
A-24
Liquidity Needs
We estimate our liquidity needs over the next twelve-month period to be approximately $4.5range from $6.6 to $6.9 billion, which includes anticipated requirements for working capital, capital expenditures,investments, interest payments and scheduled principal payments of debt and commercial paper, offset by cash and temporary cash investments on hand at the end of 2013.2015. We generally operate with a working capital deficit due to our efficient use of cash in funding operations and because we have consistent access to the capital markets. Based on current operating trends, we believe that cash flows from operating activities and other sources of liquidity, including borrowings under our commercial paper program and bank credit facility, will be adequate to meet our liquidity needs for the next twelve months and for the foreseeable future beyond the next twelve months. We have approximately $1.2 billion$990 million of commercial paper and $300 million$1.3 billion of senior notes maturing in the next twelve months, which is included in the $4.5range of $6.6 to $6.9 billion in estimated liquidity needs. We expect to refinance this debt, in 2014,2016, by issuing additional senior notes or commercial paper on favorable terms based on our past experience. We also currently plan to continue repurchases of common shares under the Company’s share repurchase programs. We may use our commercial paper program to fund debt maturities during 2014 but do not currently expect to use the program permanently. We believe we have adequate coverage of our debt covenants to continue to maintain our current debt ratings and to respond effectively to competitive conditions.
Factors Affecting Liquidity
We can currently borrow on a daily basis approximately $2$2.75 billion under our commercial paper (“CP”) program. At February 1, 2014,January 30, 2016, we had $1.2 billion$990 million of CP borrowings outstanding. CP borrowings are backed by our credit facility, and reduce the amount we can borrow under the credit facility. If our short-term credit ratings fall, the ability to borrow under our current CP program could be adversely affected for a period of time and increase our interest cost on daily borrowings under our CP program. This could require us to borrow additional funds under the credit facility, under which we believe we have sufficient capacity. However, in the event of a ratings decline, we do not anticipate that our borrowing capacity under our CP program would be any lower than $500 million on a daily basis. Although our ability to borrow under the credit facility is not affected by our credit rating, the interest cost on borrowings under the credit facility could be affected by an increase in our Leverage Ratio. As of March 28, 2014,23, 2016, we had $665 million$1.1 billion of CP borrowings outstanding. The decreaseincrease as of March 28, 2014,23, 2016, compared to year-end 2013,2015, was due to applying cash from operations againstpartially funding our year-end CP outstanding borrowings.common share repurchases.
Our credit facility requires the maintenance of a Leverage Ratio and a Fixed Charge Coverage Ratio (our “financial covenants”). A failure to maintain our financial covenants would impair our ability to borrow under the credit facility. These financial covenants and ratios are described below:
| ● | Our Leverage Ratio (the ratio of Net Debt to Consolidated EBITDA, as defined in the credit facility) was 1.97 to 1 as of January 30, 2016. If this ratio were to exceed 3.50 to 1, we would be in default of our credit facility and our ability to borrow under the facility would be impaired. In addition, our Applicable Margin on borrowings is determined by our Leverage Ratio. |
| ● | Our Fixed Charge Coverage Ratio (the ratio of Consolidated EBITDA plus Consolidated Rental Expense to Consolidated Cash Interest Expense plus Consolidated Rental Expense, as defined in the credit facility) was 5.30 to 1 as of January 30, 2016. If this ratio fell below 1.70 to 1, we would be in default of our credit facility and our ability to borrow under the facility would be impaired. |
Our credit agreement is more fully described in Note 6 to the Consolidated Financial Statements. We were in compliance with our financial covenants at year-end 2013.2015.
A-25
The tables below illustrate our significant contractual obligations and other commercial commitments, based on year of maturity or settlement, as of February 1, 2014January 30, 2016 (in millions of dollars):
| 2014 | 2015 | 2016 | 2017 | 2018 | Thereafter | Total | 2016 | 2017 | 2018 | 2019 | 2020 | Thereafter | Total | ||||||||||||||||||||||||||||||||
| Contractual Obligations(1) (2) | |||||||||||||||||||||||||||||||||||||||||||||
| Long-term debt (3) | $ | 1,616 | $ | 524 | $ | 1,267 | $ | 708 | $ | 1,003 | $ | 5,662 | $ | 10,780 | $ | 2,318 | $ | 735 | $ | 1,307 | $ | 774 | $ | 724 | $ | 5,538 | $ | 11,396 | |||||||||||||||||
| Interest on long-term debt (4) | 427 | 364 | 349 | 321 | 278 | 1,352 | 3,091 | 476 | 410 | 375 | 315 | 279 | 2,550 | 4,405 | |||||||||||||||||||||||||||||||
| Capital lease obligations | 62 | 57 | 53 | 52 | 43 | 349 | 616 | 103 | 72 | 62 | 57 | 52 | 527 | 873 | |||||||||||||||||||||||||||||||
| Operating lease obligations | 832 | 770 | 708 | 634 | 563 | 3,101 | 6,608 | 967 | 922 | 853 | 774 | 674 | 4,199 | 8,389 | |||||||||||||||||||||||||||||||
| Low-income housing obligations | 3 | — | — | — | — | — | 3 | ||||||||||||||||||||||||||||||||||||||
| Financed lease obligations | 13 | 13 | 13 | 13 | 13 | 111 | 176 | 13 | 13 | 13 | 13 | 13 | 74 | 139 | |||||||||||||||||||||||||||||||
| Self-insurance liability (5) | 224 | 131 | 88 | 52 | 26 | 48 | 569 | 223 | 138 | 98 | 63 | 38 | 79 | 639 | |||||||||||||||||||||||||||||||
| Construction commitments | 313 | — | — | — | — | — | 313 | ||||||||||||||||||||||||||||||||||||||
| Purchase obligations | 549 | 135 | 82 | 57 | 39 | 87 | 949 | ||||||||||||||||||||||||||||||||||||||
| Construction commitments(6) | 418 | — | — | — | — | — | 418 | ||||||||||||||||||||||||||||||||||||||
| Purchase obligations(7) | 532 | 161 | 77 | 58 | 42 | 106 | 976 | ||||||||||||||||||||||||||||||||||||||
| Total | $ | 4,039 | $ | 1,994 | $ | 2,560 | $ | 1,837 | $ | 1,965 | $ | 10,710 | $ | 23,105 | $ | 5,050 | $ | 2,451 | $ | 2,786 | $ | 2,054 | $ | 1,822 | $ | 13,072 | $ | 27,235 | |||||||||||||||||
| Other Commercial Commitments | |||||||||||||||||||||||||||||||||||||||||||||
| Standby letters of credit | $ | 209 | $ | — | $ | — | $ | — | $ | — | $ | — | $ | 209 | $ | 244 | $ | — | $ | — | $ | — | $ | — | $ | — | $ | 244 | |||||||||||||||||
| Surety bonds | 310 | — | — | — | — | — | 310 | 332 | — | — | — | — | — | 332 | |||||||||||||||||||||||||||||||
| Total | $ | 519 | $ | — | $ | — | $ | — | $ | — | $ | — | $ | 519 | $ | 576 | $ | — | $ | — | $ | — | $ | — | $ | — | $ | 576 | |||||||||||||||||
| (1) | The contractual obligations table excludes funding of pension and other postretirement benefit obligations, which totaled approximately | |
| (2) | The liability related to unrecognized tax benefits has been excluded from the contractual obligations table because a reasonable estimate of the timing of future tax settlements cannot be determined. | |
| (3) | As of | |
| (4) | Amounts include contractual interest payments using the interest rate as of | |
| (5) | The amounts included in the contractual obligations table for self-insurance liability related to workers’ compensation claims have been stated on a present value basis. | |
| (6) | Amounts include funds owed to third parties for projects currently under construction. These amounts are reflected in other current liabilities in our Consolidated Balance Sheets. | |
| (7) | Amounts include commitments, many of which are short-term in nature, to be utilized in the normal course of business, such as several contracts to purchase raw materials utilized in our food production plants and several contracts to purchase energy to be used in our stores and food production plants. Our obligations also include management fees for facilities operated by third parties and outside service contracts. Any upfront vendor allowances or incentives associated with outstanding purchase commitments are recorded as either current or long-term liabilities in our Consolidated Balance Sheets. | |
Our construction commitments include funds owed to third parties for projects currently under construction. These amounts are reflected in other current liabilities in our Consolidated Balance Sheets.
Our purchase obligations include commitments, many of which are short-term in nature, to be utilized in the normal course of business, such as several contracts to purchase raw materials utilized in our manufacturing plants and several contracts to purchase energy to be used in our stores and manufacturing facilities. Our obligations also include management fees for facilities operated by third parties and outside service contracts. Any upfront vendor allowances or incentives associated with outstanding purchase commitments are recorded as either current or long-term liabilities in our Consolidated Balance Sheets.
As of February 1, 2014,January 30, 2016, we maintained a $2$2.75 billion (with the ability to increase by $500$750 million), unsecured revolving credit facility that, unless extended, terminates on January 25, 2017.June 30, 2019. Outstanding borrowings under the credit agreement and commercial paper borrowings, and some outstanding letters of credit, reduce funds available under the credit agreement. In addition to the credit agreement, we maintain two uncommitted money market lines totaling $75 million in the aggregate. The money market lines allow us to borrow from banks at mutually agreed upon rates, usually at rates below the rates offered under the credit agreement. As of February 1, 2014,January 30, 2016, we had $1.2 billion$990 million of borrowings of commercial paper and no borrowings under our credit agreement and money market lines.agreement. The outstanding letters of credit that reduce funds available under our credit agreement totaled $12$13 million as of February 1, 2014.January 30, 2016.
A-26
In addition to the available credit mentioned above, as of February 1, 2014,January 30, 2016, we had authorized for issuance $2.5 billion$900 million of securities under a shelf registration statement filed with the SEC and effective on December 13, 2013.
We also maintain surety bonds related primarily to our self-insured workers’ compensation claims. These bonds are required by most states in which we are self-insured for workers’ compensation and are placed with predominately third-party insurance providers to insure payment of our obligations in the event we are unable to meet our claim payment obligations up to our self-insured retention levels. These bonds do not represent liabilities of Kroger,ours, as we already have reserves on our books for the claims costs. Market changes may make the surety bonds more costly and, in some instances, availability of these bonds may become more limited, which could affect our costs of, or access to, such bonds. Although we do not believe increased costs or decreased availability would significantly affect our ability to access these surety bonds, if this does become an issue, we would issue letters of credit, in states where allowed, against our credit facility to meet the state bonding requirements. This could increase our cost and decrease the funds available under our credit facility.
We also are contingently liable for leases that have been assigned to various third parties in connection with facility closings and dispositions. We could be required to satisfy obligations under the leases if any of the assignees are unable to fulfill their lease obligations. Due to the wide distribution of our assignments among third parties, and various other remedies available to us, we believe the likelihood that we will be required to assume a material amount of these obligations is remote. We have agreed to indemnify certain third-party logistics operators for certain expenses, including pension trust fund contribution obligations and withdrawal liabilities.
In addition to the above, we enter into various indemnification agreements and take on indemnification obligations in the ordinary course of business. Such arrangements include indemnities against third party claims arising out of agreements to provide services to Kroger;us; indemnities related to the sale of our securities; indemnities of directors, officers and employees in connection with the performance of their work; and indemnities of individuals serving as fiduciaries on benefit plans. While Kroger’sour aggregate indemnification obligation could result in a material liability, we are not aware of any current matter that could result in a material liability.
OutlookOUTLOOK
This discussion and analysis contains certain forward-looking statements about Kroger’sour future performance, including Harris Teeter.performance. These statements are based on management’s assumptions and beliefs in light of the information currently available.available to it. Such statements are indicated by words such as “comfortable,” “committed,” “will,” “expect,” “goal,” “should,” “intend,” “target,” “believe,” “anticipate,” “plan,” and similar words or phrases. These forward-looking statements are subject to uncertainties and other factors that could cause actual results to differ materially.
Statements elsewhere in this report and below regarding our expectations, projections, beliefs, intentions or strategies are forward-looking statements within the meaning of Section 21E of the Securities Exchange Act of 1934. While we believe that the statements are accurate, uncertainties about the general economy, our labor relations, our ability to execute our plans on a timely basis and other uncertainties described below could cause actual results to differ materially.
| ● | We expect net earnings to be $2.19 to $2.28 per diluted share, which is essentially in line with our long-term net earnings per diluted share growth rate of 8% - 11%. Where we fall within the range will be primarily driven by actual fuel margins, which we expect to be at or slightly below the five-year average, with continued volatility. We expect our core business in 2016 to grow in line with our long-term net earnings per diluted share growth rate of 8% – 11%. |
| ● | We expect identical supermarket sales growth, excluding fuel sales, of 2.5%-3.5% in 2016, reflecting the lower inflationary environment. |
| ● | We expect full-year FIFO operating margin in 2016, excluding fuel, to expand slightly compared to 2015 results. |
A-27
| ● | We expect capital investments, excluding mergers, acquisitions and purchases of leased facilities, to be $4.1 to $4.4 billion. These capital investments include approximately 100 major projects covering new stores, expansions and relocations, including 10 Ruler locations; 200 to 220 major remodels; and other investments including minor remodels and technology and infrastructure to support our Customer 1st business strategy. |
| ● | We expect total supermarket square footage for 2016 to grow approximately 3.0% - 3.5% before mergers, acquisitions and operational closings. |
| ● | We expect 2016 year-end ROIC to increase slightly compared to the 2015 result. |
| ● | We expect the 2016 effective tax rate to be approximately 35%, excluding the resolution of certain tax items. |
| ● | In 2016, we anticipate annualized product cost inflation of 1.0% to 2.0%, excluding fuel, and an annualized LIFO charge of approximately $50 million. We expect inflation to be lower during the earlier portion of 2016 and to gradually rise during the later portion of 2016. |
| ● | We expect 2016 Company-sponsored pension plans expense to be approximately $80 million. We do not expect to make a cash contribution in 2016. |
| ● | In 2016, we expect to contribute approximately $260 million to multi-employer pension funds. We continue to evaluate and address our potential exposure to under-funded multi-employer pension plans. Although these liabilities are not a direct obligation or liability of Kroger, any new agreements that would commit us to fund certain multi-employer plans will be expensed when our commitment is probable and an estimate can be made. |
| ● | In 2016, we will negotiate agreements with UFCW for store associates in Houston, Indianapolis, Little Rock, Nashville, Portland, Southern California and Fry’s in Arizona. Negotiations this year will be challenging as we must have competitive cost structures in each market while meeting our associates’ needs for solid wages and good quality, affordable health care and retirement benefits. |
Various uncertainties and other factors could cause actual results to differ materially from those contained in the forward-looking statements. These include:
| ● | The extent to which our sources of liquidity are sufficient to meet our requirements may be affected by the state of the financial markets and the effect that such condition has on our ability to issue commercial paper at acceptable rates. Our ability to borrow under our committed lines of credit, including our bank credit facilities, could be impaired if one or more of our lenders under those lines is unwilling or unable to honor its contractual obligation to lend to us, or in the event that natural disasters or weather conditions interfere with the ability of our lenders to lend to us. Our ability to refinance maturing debt may be affected by the state of the financial markets. |
| ● | Our ability to achieve sales, earnings and cash flow goals may be affected by: labor negotiations or disputes; changes in the types and numbers of businesses that compete with us; pricing and promotional activities of existing and new competitors, including non-traditional competitors, and the aggressiveness of that competition; our response to these actions; the state of the economy, including interest rates, the inflationary and deflationary trends in certain commodities, and the unemployment rate; the effect that fuel costs have on consumer spending; volatility of fuel margins; changes in government-funded benefit programs; manufacturing commodity costs; diesel fuel costs related to our logistics operations; trends in consumer spending; the extent to which our customers exercise caution in their purchasing in response to economic conditions; the inconsistent pace of the economic recovery; changes in inflation or deflation in product and operating costs; stock repurchases; our ability to retain pharmacy sales from third party payors; consolidation in the healthcare industry, including pharmacy benefit managers; our ability to negotiate modifications to multi-employer pension plans; natural disasters or adverse weather conditions; the potential costs and risks associated with potential cyber-attacks or data security breaches; the success of our future growth plans; and the successful integration of Harris Teeter and Roundy’s. Our ability to achieve sales and earnings goals may also be affected by our ability to manage the factors identified above. Our ability to execute our financial strategy may be affected by our ability to generate cash flow. |
A-28
| ● | During the first three quarters of each fiscal year, our LIFO charge and the recognition of LIFO expense is affected primarily by estimated year-end changes in product costs. Our fiscal year LIFO charge is affected primarily by changes in product costs at year-end. |
| ● | If actual results differ significantly from anticipated future results for certain reporting units including variable interest entities, an impairment loss for any excess of the carrying value of the reporting units’ goodwill over the implied fair value would have to be recognized. |
| ● | Our effective tax rate may differ from the expected rate due to changes in laws, the status of pending items with various taxing authorities, and the deductibility of certain expenses. |
| ● | Changes in our product mix may negatively affect certain financial indicators. For example, we continue to add supermarket fuel centers to our store base. Since fuel generates lower profit margins than our supermarket sales, we expect to see our FIFO gross margins decline as fuel sales increase. |
extent to which the adjustments we are making to our strategy create value for our shareholders will depend primarily on the reaction of our customers and our competitors to these adjustments, as well as operating conditions, including inflation or deflation, increased competitive activity, and cautious spending behavior of our customers. Our ability to achieve sales and earnings goals may also be affected by our ability to manage the factors identified above.
We cannot fully foresee the effects of changes in economic conditions on Kroger’s business. We have assumed economic and competitive situations will not change significantly in 2014.2016.
Other factors and assumptions not identified above could also cause actual results to differ materially from those set forth in the forward-looking information. Accordingly, actual events and results may vary significantly from those included in, contemplated or implied by forward-looking statements made by us or our representatives. We undertake no obligation to update the forward-looking information contained in this filing.
A-29
Report of Independent Registered Public Accounting FirmREPORTOF INDEPENDENT REGISTERED PUBLIC ACCOUNTING FIRM
To the ShareownersShareholders and Board of Directors of
The Kroger Co.
In our opinion, the accompanying consolidated balance sheets and the related consolidated statements of operations, comprehensive income, cash flows and changes in shareowners’shareholders’ equitypresent fairly, in all material respects, the financial position of The Kroger Co. and its subsidiariesat February 1, 2014January 30, 2016 and February 2, 2013,January 31, 2015, and the results of their operations and their cash flows for each of the three years in the period ended February 1, 2014 January 30, 2016in conformity with accounting principles generally accepted in the United States of America. Also in our opinion, the Company maintained, in all material respects, effective internal control over financial reporting as of February 1, 2014,January 30, 2016, based on criteria established inInternal Control - Integrated Framework (1992)(2013) issued by the Committee of Sponsoring Organizations of the Treadway Commission (COSO). The Company’s management is responsible for these financial statements, for maintaining effective internal control over financial reporting and for its assessment of the effectiveness of internal control over financial reporting, included in Management’s Report on Internal Control over Financial Reporting appearing under Item 9A.on page A-1. Our responsibility is to express opinions on these financial statements and on the Company’s internal control over financial reporting based on our integrated audits. We conducted our audits in accordance with the standards of the Public Company Accounting Oversight Board (United States). Those standards require that we plan and perform the audits to obtain reasonable assurance about whether the financial statements are free of material misstatement and whether effective internal control over financial reporting was maintained in all material respects. Our audits of the financial statements included examining, on a test basis, evidence supporting the amounts and disclosures in the financial statements, assessing the accounting principles used and significant estimates made by management, and evaluating the overall financial statement presentation. Our audit of internal control over financial reporting included obtaining an understanding of internal control over financial reporting, assessing the risk that a material weakness exists, and testing and evaluating the design and operating effectiveness of internal control based on the assessed risk. Our audits also included performing such other procedures as we considered necessary in the circumstances. We believe that our audits provide a reasonable basis for our opinions.
A company’s internal control over financial reporting is a process designed to provide reasonable assurance regarding the reliability of financial reporting and the preparation of financial statements for external purposes in accordance with generally accepted accounting principles. A company’s internal control over financial reporting includes those policies and procedures that (i) pertain to the maintenance of records that, in reasonable detail, accurately and fairly reflect the transactions and dispositions of the assets of the company; (ii) provide reasonable assurance that transactions are recorded as necessary to permit preparation of financial statements in accordance with generally accepted accounting principles, and that receipts and expenditures of the company are being made only in accordance with authorizations of management and directors of the company; and (iii) provide reasonable assurance regarding prevention or timely detection of unauthorized acquisition, use, or disposition of the company’s assets that could have a material effect on the financial statements.
Because of its inherent limitations, internal control over financial reporting may not prevent or detect misstatements. Also, projections of any evaluation of effectiveness to future periods are subject to the risk that controls may become inadequate because of changes in conditions, or that the degree of compliance with the policies or procedures may deteriorate.
A-30
As described in Management’s Report on Internal Control Over Financial Reporting, management has excluded Harris Teeter Supermarkets,Roundy’s, Inc. from its assessment of internal control over financial reporting as of February 1, 2014January 30, 2016 because it was acquired by the Company in a purchase business combination on January 28, 2014.December 18, 2015. We have also excluded Harris Teeter Supermarkets,Roundy’s, Inc. from our audit of internal control over financial reporting. Harris Teeter Supermarkets,Roundy’s, Inc. is a wholly-owned subsidiary whose total assets and total revenues represent 12%2% and less than 1%, respectively, of the related consolidated financial statement amounts as of and for the year ended February 1, 2014.January 30, 2016.

Cincinnati, OhioApril 1, 2014March 29, 2016
A-30
THE KROGER CO.
CONSOLIDATED BALANCE SHEETS
| (In millions, except par values) | January 30, 2016 | January 31, 2015 | ||||||||||
| ASSETS | ||||||||||||
| Current assets | ||||||||||||
| Cash and temporary cash investments | $ | 277 | $ | 268 | ||||||||
| Store deposits in-transit | 923 | 988 | ||||||||||
| Receivables | 1,734 | 1,266 | ||||||||||
| FIFO inventory | 7,440 | 6,933 | ||||||||||
| LIFO reserve | (1,272 | ) | (1,245 | ) | ||||||||
| Prepaid and other current assets | 790 | 701 | ||||||||||
| Total current assets | 9,892 | 8,911 | ||||||||||
| Property, plant and equipment, net | 19,619 | 17,912 | ||||||||||
| Intangibles, net | 1,053 | 757 | ||||||||||
| Goodwill | 2,724 | 2,304 | ||||||||||
| Other assets | 609 | 613 | ||||||||||
| Total Assets | $ | 33,897 | $ | 30,497 | ||||||||
| LIABILITIES | ||||||||||||
| Current liabilities | ||||||||||||
| Current portion of long-term debt including obligations under capital leases and | ||||||||||||
| financing obligations | $ | 2,370 | $ | 1,874 | ||||||||
| Trade accounts payable | 5,728 | 5,052 | ||||||||||
| Accrued salaries and wages | 1,426 | 1,291 | ||||||||||
| Deferred income taxes | 221 | 287 | ||||||||||
| Other current liabilities | 3,226 | 2,888 | ||||||||||
| Total current liabilities | 12,971 | 11,392 | ||||||||||
| Long-term debt including obligations under capital leases and financing obligations | ||||||||||||
| Face-value of long-term debt including obligations under capital leases and | ||||||||||||
| financing obligations | 9,708 | 9,723 | ||||||||||
| Adjustment to reflect fair-value interest rate hedges | 1 | — | ||||||||||
| Long-term debt including obligations under capital leases and | ||||||||||||
| financing obligations | 9,709 | 9,723 | ||||||||||
| Deferred income taxes | 1,752 | 1,209 | ||||||||||
| Pension and postretirement benefit obligations | 1,380 | 1,463 | ||||||||||
| Other long-term liabilities | 1,287 | 1,268 | ||||||||||
| Total Liabilities | 27,099 | 25,055 | ||||||||||
| Commitments and contingencies (see Note 13) | ||||||||||||
| SHAREHOLDERS’ EQUITY | ||||||||||||
| Preferred shares, $100 par per share, 5 shares authorized and unissued | — | — | ||||||||||
| Common shares, $1 par per share, 2,000 shares authorized; | ||||||||||||
| 1,918 shares issued in 2015 and 2014 | 1,918 | 1,918 | ||||||||||
| Additional paid-in capital | 2,980 | 2,748 | ||||||||||
| Accumulated other comprehensive loss | (680 | ) | (812 | ) | ||||||||
| Accumulated earnings | 14,011 | 12,367 | ||||||||||
| Common stock in treasury, at cost, 951 shares in 2015 and 944 shares in 2014 | (11,409 | ) | (10,809 | ) | ||||||||
| Total Shareholders’ Equity - The Kroger Co. | 6,820 | 5,412 | ||||||||||
| Noncontrolling interests | (22 | ) | 30 | |||||||||
| Total Equity | 6,798 | 5,442 | ||||||||||
| Total Liabilities and Equity | $ | 33,897 | $ | 30,497 | ||||||||
The accompanying notes are an integral part of the consolidated financial statements.
A-31
THE KROGER CO.
Consolidated Balance SheetsCONSOLIDATED STATEMENTSOF OPERATIONS
| February 1, | February 2, | ||||||||
| (In millions, except par values) | 2014 | 2013 | |||||||
| ASSETS | |||||||||
| Current assets | |||||||||
| Cash and temporary cash investments | $ | 401 | $ | 238 | |||||
| Store deposits in-transit | 958 | 955 | |||||||
| Receivables | 1,116 | 1,051 | |||||||
| FIFO inventory | 6,801 | 6,244 | |||||||
| LIFO reserve | (1,150 | ) | (1,098 | ) | |||||
| Prepaid and other current assets | 704 | 569 | |||||||
| Total current assets | 8,830 | 7,959 | |||||||
| Property, plant and equipment, net | 16,893 | 14,848 | |||||||
| Intangibles, net | 702 | 130 | |||||||
| Goodwill | 2,135 | 1,234 | |||||||
| Other assets | 721 | 463 | |||||||
| Total Assets | $ | 29,281 | $ | 24,634 | |||||
| LIABILITIES | |||||||||
| Current liabilities | |||||||||
| Current portion of long-term debt including obligations under capital leases | |||||||||
| and financing obligations | $ | 1,657 | $ | 2,734 | |||||
| Trade accounts payable | 4,881 | 4,484 | |||||||
| Accrued salaries and wages | 1,150 | 1,017 | |||||||
| Deferred income taxes | 248 | 288 | |||||||
| Other current liabilities | 2,769 | 2,538 | |||||||
| Total current liabilities | 10,705 | 11,061 | |||||||
| Long-term debt including obligations under capital leases and financing obligations | |||||||||
| Face-value of long-term debt including obligations under capital leases and | |||||||||
| financing obligations | 9,654 | 6,141 | |||||||
| Adjustment to reflect fair-value interest rate hedges | (1 | ) | 4 | ||||||
| Long-term debt including obligations under capital leases and financing obligations | 9,653 | 6,145 | |||||||
| Deferred income taxes | 1,381 | 796 | |||||||
| Pension and postretirement benefit obligations | 901 | 1,291 | |||||||
| Other long-term liabilities | 1,246 | 1,127 | |||||||
| Total Liabilities | 23,886 | 20,420 | |||||||
| Commitments and contingencies (see Note 13) | |||||||||
| SHAREOWNERS’ EQUITY | |||||||||
| Preferred shares, $100 par per share, 5 shares authorized and unissued | — | — | |||||||
| Common shares, $1 par per share, 1,000 shares authorized; | |||||||||
| 959 shares issued in 2013 and 2012 | 959 | 959 | |||||||
| Additional paid-in capital | 3,549 | 3,451 | |||||||
| Accumulated other comprehensive loss | (464 | ) | (753 | ) | |||||
| Accumulated earnings | 10,981 | 9,787 | |||||||
| Common stock in treasury, at cost, 451 shares in 2013 and 445 shares in 2012 | (9,641 | ) | (9,237 | ) | |||||
| Total Shareowners’ Equity - The Kroger Co. | 5,384 | 4,207 | |||||||
| Noncontrolling interests | 11 | 7 | |||||||
| Total Equity | 5,395 | 4,214 | |||||||
| Total Liabilities and Equity | $ | 29,281 | $ | 24,634 | |||||
Years Ended January 30, 2016, January 31, 2015 and February 1, 2014
| (In millions, except per share amounts) | 2015 (52 weeks) | 2014 (52 weeks) | 2013 (52 weeks) | ||||||||||||
| Sales | $ | 109,830 | $ | 108,465 | $ | 98,375 | |||||||||
| Merchandise costs, including advertising, warehousing, and | |||||||||||||||
| transportation, excluding items shown separately below | 85,496 | 85,512 | 78,138 | ||||||||||||
| Operating, general and administrative | 17,946 | 17,161 | 15,196 | ||||||||||||
| Rent | 723 | 707 | 613 | ||||||||||||
| Depreciation and amortization | 2,089 | 1,948 | 1,703 | ||||||||||||
| Operating Profit | 3,576 | 3,137 | 2,725 | ||||||||||||
| Interest expense | 482 | 488 | 443 | ||||||||||||
| Earnings before income tax expense | 3,094 | 2,649 | 2,282 | ||||||||||||
| Income tax expense | 1,045 | 902 | 751 | ||||||||||||
| Net earnings including noncontrolling interests | 2,049 | 1,747 | 1,531 | ||||||||||||
| Net earnings attributable to noncontrolling interests | 10 | 19 | 12 | ||||||||||||
| Net earnings attributable to The Kroger Co. | $ | 2,039 | $ | 1,728 | $ | 1,519 | |||||||||
| Net earnings attributable to The Kroger Co. per basic common share | $ | 2.09 | $ | 1.74 | $ | 1.47 | |||||||||
| Average number of common shares used in basic calculation | 966 | 981 | 1,028 | ||||||||||||
| Net earnings attributable to The Kroger Co. per diluted common share | $ | 2.06 | $ | 1.72 | $ | 1.45 | |||||||||
| Average number of common shares used in diluted calculation | 980 | 993 | 1,040 | ||||||||||||
| Dividends declared per common share | $ | 0.408 | $ | 0.350 | $ | 0.315 | |||||||||
The accompanying notes are an integral part of the consolidated financial statements.
A-32
THE KROGER CO.
Consolidated Statements of OperationsCONSOLIDATED STATEMENTSOF COMPREHENSIVE INCOME
Years Ended January 30, 2016, January 31, 2015 and February 1, 2014 February 2, 2013 and January 28, 2012
| 2013 | 2012 | 2011 | |||||||||||
| (In millions, except per share amounts) | (52 weeks) | (53 weeks) | (52 weeks) | ||||||||||
| Sales | $ | 98,375 | $ | 96,619 | $ | 90,269 | |||||||
| Merchandise costs, including advertising, warehousing, and | |||||||||||||
| transportation, excluding items shown separately below | 78,138 | 76,726 | 71,389 | ||||||||||
| Operating, general and administrative | 15,196 | 14,849 | 15,345 | ||||||||||
| Rent | 613 | 628 | 619 | ||||||||||
| Depreciation | 1,703 | 1,652 | 1,638 | ||||||||||
| Operating Profit | 2,725 | 2,764 | 1,278 | ||||||||||
| Interest expense | 443 | 462 | 435 | ||||||||||
| Earnings before income tax expense | 2,282 | 2,302 | 843 | ||||||||||
| Income tax expense | 751 | 794 | 247 | ||||||||||
| Net earnings including noncontrolling interests | 1,531 | 1,508 | 596 | ||||||||||
| Net earnings (loss) attributable to noncontrolling interests | 12 | 11 | (6 | ) | |||||||||
| Net earnings attributable to The Kroger Co. | $ | 1,519 | $ | 1,497 | $ | 602 | |||||||
| Net earnings attributable to The Kroger Co. per basic common share | $ | 2.93 | $ | 2.78 | $ | 1.01 | |||||||
| Average number of common shares used in basic calculation | 514 | 533 | 590 | ||||||||||
| Net earnings attributable to The Kroger Co. per diluted common share | $ | 2.90 | $ | 2.77 | $ | 1.01 | |||||||
| Average number of common shares used in diluted calculation | 520 | 537 | 593 | ||||||||||
| Dividends declared per common share | $ | 0.63 | $ | 0.53 | $ | 0.44 | |||||||
| (In millions) | 2015 (52 weeks) | 2014 (52 weeks) | 2013 (52 weeks) | |||||||||||||||
| Net earnings including noncontrolling interests | $ | 2,049 | $ | 1,747 | $ | 1,531 | ||||||||||||
| Other comprehensive income (loss) | ||||||||||||||||||
| Unrealized gain on available for sale securities, net of | ||||||||||||||||||
| income tax(1) | 3 | 5 | 5 | |||||||||||||||
| Change in pension and other postretirement defined benefit plans, | ||||||||||||||||||
| net of income tax(2) | 131 | (329 | ) | 295 | ||||||||||||||
| Unrealized losses on cash flow hedging activities, | ||||||||||||||||||
| net of income tax(3) | (3 | ) | (25 | ) | (12 | ) | ||||||||||||
| Amortization of unrealized gains and losses on cash flow hedging | ||||||||||||||||||
| activities, net of income tax(4) | 1 | 1 | 1 | |||||||||||||||
| Total other comprehensive income (loss) | 132 | (348 | ) | 289 | ||||||||||||||
| Comprehensive income | 2,181 | 1,399 | 1,820 | |||||||||||||||
| Comprehensive income attributable to noncontrolling interests | 10 | 19 | 12 | |||||||||||||||
| Comprehensive income attributable to The Kroger Co. | $ | 2,171 | $ | 1,380 | $ | 1,808 | ||||||||||||
| (1) | Amount is net of tax of $2 in 2015 and $3 in 2014 and 2013. |
| (2) | Amount is net of tax of $77 in 2015, $(193) in 2014 and $173 in 2013. |
| (3) | Amount is net of tax of $(2) in 2015, $(14) in 2014 and $(8) in 2013. |
| (4) | Amount is net of tax of $1 in 2013. |
The accompanying notes are an integral part of the consolidated financial statements.
A-33
THE KROGER CO.
Consolidated Statements of Comprehensive IncomeCONSOLIDATED STATEMENTS oF CASH FLOWS
Years Ended January 30, 2016, January 31, 2015 and February 1, 2014 February 2, 2013 and January 28, 2012
| 2013 | 2012 | 2011 | |||||||||||||||
| (In millions) | (52 weeks) | (53 weeks) | (52 weeks) | ||||||||||||||
| Net earnings including noncontrolling interests | $ | 1,531 | $ | 1,508 | $ | 596 | |||||||||||
| Other comprehensive income (loss) | |||||||||||||||||
| Unrealized gain on available for sale securities, net of income tax (1) | 5 | — | 2 | ||||||||||||||
| Change in pension and other postretirement defined benefit plans, | |||||||||||||||||
| net of income tax (2) | 295 | 75 | (271 | ) | |||||||||||||
| Unrealized gains and losses on cash flow hedging activities, | |||||||||||||||||
| net of income tax (3) | (12 | ) | 13 | (26 | ) | ||||||||||||
| Amortization of unrealized gains and losses on cash flow hedging | |||||||||||||||||
| activities, net of income tax (4) | 1 | 3 | 1 | ||||||||||||||
| Total other comprehensive income (loss) | 289 | 91 | (294 | ) | |||||||||||||
| Comprehensive income | 1,820 | 1,599 | 302 | ||||||||||||||
| Comprehensive income (loss) attributable to noncontrolling interests | 12 | 11 | (6 | ) | |||||||||||||
| Comprehensive income attributable to The Kroger Co. | $ | 1,808 | $ | 1,588 | $ | 308 | |||||||||||
| (In millions) | 2015 (52 weeks) | 2014 (52 weeks) | 2013 (52 weeks) | ||||||||||||||
| Cash Flows From Operating Activities: | |||||||||||||||||
| Net earnings including noncontrolling interests | $ | 2,049 | $ | 1,747 | $ | 1,531 | |||||||||||
| Adjustments to reconcile net earnings to net cash provided by operating activities: | |||||||||||||||||
| Depreciation and amortization | 2,089 | 1,948 | 1,703 | ||||||||||||||
| Asset impairment charge | 46 | 37 | 39 | ||||||||||||||
| LIFO charge | 28 | 147 | 52 | ||||||||||||||
| Stock-based employee compensation | 165 | 155 | 107 | ||||||||||||||
| Expense for Company-sponsored pension plans | 103 | 55 | 74 | ||||||||||||||
| Deferred income taxes | 317 | 73 | 72 | ||||||||||||||
| Other | 54 | 72 | 47 | ||||||||||||||
| Changes in operating assets and liabilities net of effects from mergers of businesses: | |||||||||||||||||
| Store deposits in-transit | 95 | (27 | ) | 25 | |||||||||||||
| Receivables | (59 | ) | (141 | ) | (8 | ) | |||||||||||
| Inventories | (184 | ) | (147 | ) | (131 | ) | |||||||||||
| Prepaid and other current assets | (28 | ) | 2 | (49 | ) | ||||||||||||
| Trade accounts payable | 440 | 135 | 196 | ||||||||||||||
| Accrued expenses | 191 | 197 | 77 | ||||||||||||||
| Income taxes receivable and payable | (359 | ) | (68 | ) | (47 | ) | |||||||||||
| Contribution to Company-sponsored pension plans | (5 | ) | — | (100 | ) | ||||||||||||
| Other | (109 | ) | (22 | ) | (15 | ) | |||||||||||
| Net cash provided by operating activities | 4,833 | 4,163 | 3,573 | ||||||||||||||
| Cash Flows From Investing Activities: | |||||||||||||||||
| Payments for property and equipment, including payments for lease buyouts | (3,349 | ) | (2,831 | ) | (2,330 | ) | |||||||||||
| Proceeds from sale of assets | 45 | 37 | 24 | ||||||||||||||
| Payments for mergers | (168 | ) | (252 | ) | (2,344 | ) | |||||||||||
| Other | (98 | ) | (14 | ) | (121 | ) | |||||||||||
| Net cash used by investing activities | (3,570 | ) | (3,060 | ) | (4,771 | ) | |||||||||||
| Cash Flows From Financing Activities: | |||||||||||||||||
| Proceeds from issuance of long-term debt | 1,181 | 576 | 3,548 | ||||||||||||||
| Payments on long-term debt | (1,245 | ) | (375 | ) | (1,060 | ) | |||||||||||
| Net (payments) borrowings on commercial paper | (285 | ) | 25 | (395 | ) | ||||||||||||
| Dividends paid | (385 | ) | (338 | ) | (319 | ) | |||||||||||
| Excess tax benefits on stock based awards | 97 | 52 | 32 | ||||||||||||||
| Proceeds from issuance of capital stock | 120 | 110 | 196 | ||||||||||||||
| Treasury stock purchases | (703 | ) | (1,283 | ) | (609 | ) | |||||||||||
| Investment in the remaining equity of a noncontrolling interest | (26 | ) | — | — | |||||||||||||
| Other | (8 | ) | (3 | ) | (32 | ) | |||||||||||
| Net cash provided (used) by financing activities | (1,254 | ) | (1,236 | ) | 1,361 | ||||||||||||
| Net increase (decrease) in cash and temporary cash investments | 9 | (133 | ) | 163 | |||||||||||||
| Cash and temporary cash investments: | |||||||||||||||||
| Beginning of year | 268 | 401 | 238 | ||||||||||||||
| End of year | $ | 277 | $ | 268 | $ | 401 | |||||||||||
| Reconciliation of capital investments: | |||||||||||||||||
| Payments for property and equipment, including payments for lease buyouts | $ | (3,349 | ) | $ | (2,831 | ) | $ | (2,330 | ) | ||||||||
| Payments for lease buyouts | 35 | 135 | 108 | ||||||||||||||
| Changes in construction-in-progress payables | (35 | ) | (56 | ) | (83 | ) | |||||||||||
| Total capital investments, excluding lease buyouts | $ | (3,349 | ) | $ | (2,752 | ) | $ | (2,305 | ) | ||||||||
| Disclosure of cash flow information: | |||||||||||||||||
| Cash paid during the year for interest | $ | 474 | $ | 477 | $ | 401 | |||||||||||
| Cash paid during the year for income taxes | $ | 1,001 | $ | 941 | $ | 679 | |||||||||||
The accompanying notes are an integral part of the consolidated financial statements.
A-34
THE KROGER CO.
Consolidated Statements of Cash FlowsCONSOLIDATED STATEMENTOF CHANGESIN SHAREHOLDERS’ EQUITY
Years Ended January 30, 2016, January 31, 2015 and February 1, 2014 February 2, 2013 and January 28, 2012
| 2013 | 2012 | 2011 | ||||||||||||||||
| (In millions) | (52 weeks) | (53 weeks) | (52 weeks) | |||||||||||||||
| Cash Flows From Operating Activities: | ||||||||||||||||||
| Net earnings including noncontrolling interests | $ | 1,531 | $ | 1,508 | $ | 596 | ||||||||||||
| Adjustments to reconcile net earnings to net cash provided by operating activities: | ||||||||||||||||||
| Depreciation | 1,703 | 1,652 | 1,638 | |||||||||||||||
| Asset impairment charge | 39 | 18 | 37 | |||||||||||||||
| LIFO charge | 52 | 55 | 216 | |||||||||||||||
| Stock-based employee compensation | 107 | 82 | 81 | |||||||||||||||
| Expense for Company-sponsored pension plans | 74 | 89 | 70 | |||||||||||||||
| Deferred income taxes | 72 | 176 | 31 | |||||||||||||||
| Other | 47 | 23 | 3 | |||||||||||||||
| Changes in operating assets and liabilities net of effects from acquisitions | ||||||||||||||||||
| of businesses: | ||||||||||||||||||
| Store deposits in-transit | 25 | (169 | ) | (120 | ) | |||||||||||||
| Inventories | (131 | ) | (78 | ) | (361 | ) | ||||||||||||
| Receivables | (8 | ) | (126 | ) | (63 | ) | ||||||||||||
| Prepaid expenses | (49 | ) | (257 | ) | 52 | |||||||||||||
| Trade accounts payable | 3 | 67 | 83 | |||||||||||||||
| Accrued expenses | 77 | 67 | 215 | |||||||||||||||
| Income taxes receivable and payable | (47 | ) | 164 | (106 | ) | |||||||||||||
| Contribution to Company-sponsored pension plans | (100 | ) | (71 | ) | (52 | ) | ||||||||||||
| Other | (15 | ) | (367 | ) | 338 | |||||||||||||
| Net cash provided by operating activities | 3,380 | 2,833 | 2,658 | |||||||||||||||
| Cash Flows From Investing Activities: | ||||||||||||||||||
| Payments for property and equipment, including payments for lease buyouts | (2,330 | ) | (2,062 | ) | (1,898 | ) | ||||||||||||
| Proceeds from sale of assets | 24 | 49 | 51 | |||||||||||||||
| Payments for acquisitions | (2,344 | ) | (122 | ) | (51 | ) | ||||||||||||
| Other | (121 | ) | (48 | ) | (10 | ) | ||||||||||||
| Net cash used by investing activities | (4,771 | ) | (2,183 | ) | (1,908 | ) | ||||||||||||
| Cash Flows From Financing Activities: | ||||||||||||||||||
| Proceeds from issuance of long-term debt | 3,548 | 863 | 453 | |||||||||||||||
| Payments on long-term debt | (1,060 | ) | (1,445 | ) | (547 | ) | ||||||||||||
| Net (payments) borrowings of commercial paper | (395 | ) | 1,275 | 370 | ||||||||||||||
| Proceeds from issuance of capital stock | 196 | 110 | 118 | |||||||||||||||
| Treasury stock purchases | (609 | ) | (1,261 | ) | (1,547 | ) | ||||||||||||
| Dividends paid | (319 | ) | (267 | ) | (257 | ) | ||||||||||||
| Net increase in book overdrafts | 193 | 121 | 19 | |||||||||||||||
| Other | — | 4 | 4 | |||||||||||||||
| Net cash provided (used) by financing activities | 1,554 | (600 | ) | (1,387 | ) | |||||||||||||
| Net increase (decrease) in cash and temporary cash investments | 163 | 50 | (637 | ) | ||||||||||||||
| Cash and temporary cash investments: | ||||||||||||||||||
| Beginning of year | 238 | 188 | 825 | |||||||||||||||
| End of year | $ | 401 | $ | 238 | $ | 188 | ||||||||||||
| Reconciliation of capital investments: | ||||||||||||||||||
| Payments for property and equipment, including payments for lease buyouts | $ | (2,330 | ) | $ | (2,062 | ) | $ | (1,898 | ) | |||||||||
| Payments for lease buyouts | 108 | 73 | 60 | |||||||||||||||
| Changes in construction-in-progress payables | (83 | ) | (1 | ) | (60 | ) | ||||||||||||
| Total capital investments, excluding lease buyouts | $ | (2,305 | ) | $ | (1,990 | ) | $ | (1,898 | ) | |||||||||
| Disclosure of cash flow information: | ||||||||||||||||||
| Cash paid during the year for interest | $ | 401 | $ | 438 | $ | 457 | ||||||||||||
| Cash paid during the year for income taxes | $ | 679 | $ | 468 | $ | 296 | ||||||||||||
| (In millions, except per share amounts) | Common Stock | Additional Paid-In Capital | Treasury Stock | Accumulated Other Comprehensive Gain (Loss) | Accumulated Earnings | Noncontrolling Interest | Total | |||||||||||||||||||||||||||||||||||||||
| Shares | Amount | Shares | Amount | |||||||||||||||||||||||||||||||||||||||||||
| Balances at February 2, 2013 | 1,918 | $ | 1,918 | $ | 2,492 | 890 | $ | (9,237 | ) | $ | (753 | ) | $ | 9,787 | $ | 7 | $ | 4,214 | ||||||||||||||||||||||||||||
| Issuance of common stock: | ||||||||||||||||||||||||||||||||||||||||||||||
| Stock options exercised | — | — | — | (18 | ) | 196 | — | — | — | 196 | ||||||||||||||||||||||||||||||||||||
| Restricted stock issued | — | — | (60 | ) | (5 | ) | 26 | — | — | — | (34 | ) | ||||||||||||||||||||||||||||||||||
| Treasury stock activity: | ||||||||||||||||||||||||||||||||||||||||||||||
| Treasury stock purchases, at cost | — | — | — | 18 | (338 | ) | — | — | — | (338 | ) | |||||||||||||||||||||||||||||||||||
| Stock options exchanged | — | — | — | 17 | (271 | ) | — | — | — | (271 | ) | |||||||||||||||||||||||||||||||||||
| Share-based employee compensation | — | — | 107 | — | — | — | — | — | 107 | |||||||||||||||||||||||||||||||||||||
| Other comprehensive gain net of | ||||||||||||||||||||||||||||||||||||||||||||||
| income tax of $168 | — | — | — | — | — | 289 | — | — | 289 | |||||||||||||||||||||||||||||||||||||
| Other | — | — | 51 | — | (17 | ) | — | — | (8 | ) | 26 | |||||||||||||||||||||||||||||||||||
| Cash dividends declared | ||||||||||||||||||||||||||||||||||||||||||||||
| ($0.315 per common share) | — | — | — | — | — | — | (325 | ) | — | (325 | ) | |||||||||||||||||||||||||||||||||||
| Net earnings including | ||||||||||||||||||||||||||||||||||||||||||||||
| non-controlling interests | — | — | — | — | — | — | 1,519 | 12 | 1,531 | |||||||||||||||||||||||||||||||||||||
| Balances at February 1, 2014 | 1,918 | $ | 1,918 | $ | 2,590 | 902 | $ | (9,641 | ) | $ | (464 | ) | $ | 10,981 | $ | 11 | $ | 5,395 | ||||||||||||||||||||||||||||
| Issuance of common stock: | ||||||||||||||||||||||||||||||||||||||||||||||
| Stock options exercised | — | — | — | (10 | ) | 110 | — | — | — | 110 | ||||||||||||||||||||||||||||||||||||
| Restricted stock issued | — | — | (91 | ) | (5 | ) | 40 | — | — | — | (51 | ) | ||||||||||||||||||||||||||||||||||
| Treasury stock activity: | ||||||||||||||||||||||||||||||||||||||||||||||
| Treasury stock purchases, at cost | — | — | — | 51 | (1,129 | ) | — | — | — | (1,129 | ) | |||||||||||||||||||||||||||||||||||
| Stock options exchanged | — | — | — | 6 | (154 | ) | — | — | — | (154 | ) | |||||||||||||||||||||||||||||||||||
| Share-based employee compensation | — | — | 155 | — | — | — | — | — | 155 | |||||||||||||||||||||||||||||||||||||
| Other comprehensive loss net of income | ||||||||||||||||||||||||||||||||||||||||||||||
| tax of ($204) | — | — | — | — | — | (348 | ) | — | — | (348 | ) | |||||||||||||||||||||||||||||||||||
| Other | — | — | 94 | — | (35 | ) | — | — | — | 59 | ||||||||||||||||||||||||||||||||||||
| Cash dividends declared | ||||||||||||||||||||||||||||||||||||||||||||||
| ($0.350 per common share) | — | — | — | — | — | — | (342 | ) | — | (342 | ) | |||||||||||||||||||||||||||||||||||
| Net earnings including | ||||||||||||||||||||||||||||||||||||||||||||||
| non-controlling interests | — | — | — | — | — | — | 1,728 | 19 | 1,747 | |||||||||||||||||||||||||||||||||||||
| Balances at January 31, 2015 | 1,918 | $ | 1,918 | $ | 2,748 | 944 | $ | (10,809 | ) | $ | (812 | ) | $ | 12,367 | $ | 30 | $ | 5,442 | ||||||||||||||||||||||||||||
| Issuance of common stock: | ||||||||||||||||||||||||||||||||||||||||||||||
| Stock options exercised | — | — | — | (9 | ) | 120 | — | — | — | 120 | ||||||||||||||||||||||||||||||||||||
| Restricted stock issued | — | — | (122 | ) | (5 | ) | 37 | — | — | — | (85 | ) | ||||||||||||||||||||||||||||||||||
| Treasury stock activity: | ||||||||||||||||||||||||||||||||||||||||||||||
| Treasury stock purchases, at cost | — | — | — | 14 | (500 | ) | — | — | — | (500 | ) | |||||||||||||||||||||||||||||||||||
| Stock options exchanged | — | — | — | 7 | (203 | ) | — | — | — | (203 | ) | |||||||||||||||||||||||||||||||||||
| Share-based employee compensation | — | — | 165 | — | — | — | — | — | 165 | |||||||||||||||||||||||||||||||||||||
| Other comprehensive gain net of income | ||||||||||||||||||||||||||||||||||||||||||||||
| tax of $77 | — | — | — | — | — | 132 | — | — | 132 | |||||||||||||||||||||||||||||||||||||
| Investment in the remaining equity of a | ||||||||||||||||||||||||||||||||||||||||||||||
| non-controlling interest | — | — | 26 | — | — | — | — | (57 | ) | (31 | ) | |||||||||||||||||||||||||||||||||||
| Other | — | — | 163 | — | (54 | ) | — | — | (5 | ) | 104 | |||||||||||||||||||||||||||||||||||
| Cash dividends declared | ||||||||||||||||||||||||||||||||||||||||||||||
| ($0.408 per common share) | — | — | — | — | — | — | (395 | ) | — | (395 | ) | |||||||||||||||||||||||||||||||||||
| Net earnings including | ||||||||||||||||||||||||||||||||||||||||||||||
| non-controlling interests | — | — | — | — | — | — | 2,039 | 10 | 2,049 | |||||||||||||||||||||||||||||||||||||
| Balances at January 30, 2016 | 1,918 | $ | 1,918 | $ | 2,980 | 951 | $ | (11,409 | ) | $ | (680 | ) | $ | 14,011 | $ | (22 | ) | $ | 6,798 | |||||||||||||||||||||||||||
The accompanying notes are an integral part of the consolidated financial statements.
A-35
THE KROGER CO.NOTESTO CONSOLIDATED FINANCIAL STATEMENTS
Consolidated Statement of ChangesAll amounts in Shareowners’ Equity
Years Ended February 1, 2014, February 2, 2013 and January 28, 2012
| Accumulated | ||||||||||||||||||||||||||||||||||||||||||||||
| Additional | Other | |||||||||||||||||||||||||||||||||||||||||||||
| Common Stock | Paid-In | Treasury Stock | Comprehensive | Accumulated | Noncontrolling | |||||||||||||||||||||||||||||||||||||||||
| (In millions, except per share amounts) | Shares | Amount | Capital | Shares | Amount | Gain (Loss) | Earnings | Interest | Total | |||||||||||||||||||||||||||||||||||||
| Balances at January 29, 2011 | 959 | $ | 959 | $ | 3,394 | 339 | $ | (6,732 | ) | $ | (550 | ) | $ | 8,225 | $ | 2 | $ | 5,298 | ||||||||||||||||||||||||||||
| Issuance of common stock: | ||||||||||||||||||||||||||||||||||||||||||||||
| Stock options exercised | — | — | — | (6 | ) | 118 | — | — | — | 118 | ||||||||||||||||||||||||||||||||||||
| Restricted stock issued | — | — | (55 | ) | (2 | ) | 34 | — | — | — | (21 | ) | ||||||||||||||||||||||||||||||||||
| Treasury stock activity: | ||||||||||||||||||||||||||||||||||||||||||||||
| Treasury stock purchases, at cost | — | — | — | 61 | (1,420 | ) | — | — | — | (1,420 | ) | |||||||||||||||||||||||||||||||||||
| Stock options exchanged | — | — | — | 6 | (127 | ) | — | — | — | (127 | ) | |||||||||||||||||||||||||||||||||||
| Share-based employee compensation | — | — | 81 | — | — | — | — | — | 81 | |||||||||||||||||||||||||||||||||||||
| Other comprehensive loss net of income | ||||||||||||||||||||||||||||||||||||||||||||||
| tax of $(167) | — | — | — | — | — | (294 | ) | — | — | (294 | ) | |||||||||||||||||||||||||||||||||||
| Other | — | — | 7 | — | (5 | ) | — | — | (11 | ) | (9 | ) | ||||||||||||||||||||||||||||||||||
| Cash dividends declared | ||||||||||||||||||||||||||||||||||||||||||||||
| ($0.44 per common share) | — | — | — | — | — | — | (256 | ) | — | (256 | ) | |||||||||||||||||||||||||||||||||||
| Net earnings (loss) including non-controlling | ||||||||||||||||||||||||||||||||||||||||||||||
| interests | — | — | — | — | — | — | 602 | (6 | ) | 596 | ||||||||||||||||||||||||||||||||||||
| Balances at January 28, 2012 | 959 | $ | 959 | $ | 3,427 | 398 | $ | (8,132 | ) | $ | (844 | ) | $ | 8,571 | $ | (15 | ) | $ | 3,966 | |||||||||||||||||||||||||||
| Issuance of common stock: | ||||||||||||||||||||||||||||||||||||||||||||||
| Stock options exercised | — | — | — | (7 | ) | 110 | — | — | — | 110 | ||||||||||||||||||||||||||||||||||||
| Restricted stock issued | — | — | (59 | ) | (2 | ) | 40 | — | — | — | (19 | ) | ||||||||||||||||||||||||||||||||||
| Treasury stock activity: | ||||||||||||||||||||||||||||||||||||||||||||||
| Treasury stock purchases, at cost | — | — | — | 51 | (1,165 | ) | — | — | — | (1,165 | ) | |||||||||||||||||||||||||||||||||||
| Stock options exchanged | — | — | — | 5 | (96 | ) | — | — | — | (96 | ) | |||||||||||||||||||||||||||||||||||
| Share-based employee compensation | — | — | 82 | — | — | — | — | — | 82 | |||||||||||||||||||||||||||||||||||||
| Other comprehensive gain net of income tax | ||||||||||||||||||||||||||||||||||||||||||||||
| of $54 | — | — | — | — | — | 91 | — | — | 91 | |||||||||||||||||||||||||||||||||||||
| Other | — | — | 1 | — | 6 | — | — | 11 | 18 | |||||||||||||||||||||||||||||||||||||
| Cash dividends declared | ||||||||||||||||||||||||||||||||||||||||||||||
| ($0.53 per common share) | — | — | — | — | — | — | (281 | ) | — | (281 | ) | |||||||||||||||||||||||||||||||||||
| Net earnings including non-controlling interests | — | — | — | — | — | — | 1,497 | 11 | 1,508 | |||||||||||||||||||||||||||||||||||||
| Balances at February 2, 2013 | 959 | $ | 959 | $ | 3,451 | 445 | $ | (9,237 | ) | $ | (753 | ) | $ | 9,787 | $ | 7 | $ | 4,214 | ||||||||||||||||||||||||||||
| Issuance of common stock: | ||||||||||||||||||||||||||||||||||||||||||||||
| Stock options exercised | — | — | — | (9 | ) | 196 | — | — | — | 196 | ||||||||||||||||||||||||||||||||||||
| Restricted stock issued | — | — | (60 | ) | (2 | ) | 26 | — | — | — | (34 | ) | ||||||||||||||||||||||||||||||||||
| Treasury stock activity: | ||||||||||||||||||||||||||||||||||||||||||||||
| Treasury stock purchases, at cost | — | — | — | 9 | (338 | ) | — | — | — | (338 | ) | |||||||||||||||||||||||||||||||||||
| Stock options exchanged | — | — | — | 8 | (271 | ) | — | — | — | (271 | ) | |||||||||||||||||||||||||||||||||||
| Share-based employee compensation | — | — | 107 | — | — | — | — | — | 107 | |||||||||||||||||||||||||||||||||||||
| Other comprehensive gain net of income tax | ||||||||||||||||||||||||||||||||||||||||||||||
| of $169 | — | — | — | — | — | 289 | — | — | 289 | |||||||||||||||||||||||||||||||||||||
| Other | — | — | 51 | — | (17 | ) | — | — | (8 | ) | 26 | |||||||||||||||||||||||||||||||||||
| Cash dividends declared | ||||||||||||||||||||||||||||||||||||||||||||||
| ($0.63 per common share) | — | — | — | — | — | — | (325 | ) | — | (325 | ) | |||||||||||||||||||||||||||||||||||
| Net earnings including non-controlling interests | — | — | — | — | — | — | 1,519 | 12 | 1,531 | |||||||||||||||||||||||||||||||||||||
| Balances at February 1, 2014 | 959 | $ | 959 | $ | 3,549 | 451 | $ | (9,641 | ) | $ | (464 | ) | $ | 10,981 | $ | 11 | $ | 5,395 | ||||||||||||||||||||||||||||
The accompanying notes are an integral part of the consolidated financial statements.
A-36
Notes to Consolidated Financial Statements
All dollar amounts are in millions except share and per share amounts.
Certain prior-year amounts have been reclassified to conform to current year presentation.
1. Accounting PoliciesACCOUNTING POLICIES
The following is a summary of the significant accounting policies followed in preparing these financial statements.
Description of Business, Basis of Presentation and Principles of Consolidation
The Kroger Co. (the “Company”) was founded in 1883 and incorporated in 1902. As of February 1, 2014,January 30, 2016, the Company was one of the largest retailers in the United Statesnation based on annual sales. The Company also manufactures and processes food for sale by its supermarkets. The accompanying financial statements include the consolidated accounts of the Company, its wholly-owned subsidiaries and the Variable Interest Entities (“VIEs”)variable interest entities in which the Company is the primary beneficiary. Significant intercompany transactions and balances have been eliminated.
Certain revenue transactions previously reported in sales and merchandise costsOn June 25, 2015, the Company’s Board of Directors approved a two-for-one stock split of The Kroger Co.’s common shares in the form of a 100% stock dividend, which was effective July 13, 2015. All share and per share amounts in the Company’s Consolidated Financial Statements of Operations are now reported net within sales. Certain prior year amountsand related notes have been revised or reclassifiedretroactively adjusted to conformreflect the stock split for all periods presented.
Refer to Note 17 for an additional change to the current year presentation. These amounts were not material toConsolidated Balance Sheets for a recently adopted accounting standard regarding the prior periods.presentation of debt issuance costs.
Fiscal Year
The Company’s fiscal year ends on the Saturday nearest January 31. The last three fiscal years consist of the 52-week periods ended January 30, 2016, January 31, 2015 and February 1, 2014 and January 28, 2012 and the 53-week period ended February 2, 2013.2014.
Pervasiveness of Estimates
The preparation of financial statements in conformity with generally accepted accounting principles (“GAAP”) requires management to make estimates and assumptions that affect the reported amounts of assets and liabilities. Disclosure of contingent assets and liabilities as of the date of the consolidated financial statements and the reported amounts of consolidated revenues and expenses during the reporting period is also is required. Actual results could differ from those estimates.
InventoriesCash, Temporary Cash Investments and Book Overdrafts
Cash and temporary cash investments represent store cash and short-term investments with original maturities of less than three months. Book overdrafts are included in “Trade accounts payable” and “Accrued salaries and wages” in the Consolidated Balance Sheets.
Deposits In-Transit
Deposits in-transit generally represent funds deposited to the Company’s bank accounts at the end of the year related to sales, a majority of which were paid for with debit cards, credit cards and checks, to which the Company does not have immediate access but settle within a few days of the sales transaction.
Inventories
Inventories are stated at the lower of cost (principally on a last-in, first-out “LIFO” basis) or market. In total, approximately 95% and 96% of inventories for 2013in 2015 and 2012, respectively,2014 were valued using the LIFO method. Cost for the balance of the inventories, including substantially all fuel inventories, was determined using the first-in, first-out (“FIFO”) method. Replacement cost was higher than the carrying amount by $1,150$1,272 at February 1, 2014January 30, 2016 and $1,098$1,245 at February 2, 2013.January 31, 2015. The Company follows the Link-Chain, Dollar-Value LIFO method for purposes of calculating its LIFO charge or credit.
A-36
The item-cost method of accounting to determine inventory cost before the LIFO adjustment is followed for substantially all store inventories at the Company’s supermarket divisions. This method involves counting each item in inventory, assigning costs to each of these items based on the actual purchase costs (net of vendor allowances and cash discounts) of each item and recording the cost of items sold. The item-cost method of accounting allows for more accurate reporting of periodic inventory balances and enables management to more precisely manage inventory. In addition, substantially all of the Company’s inventory consists of finished goods and is recorded at actual purchase costs (net of vendor allowances and cash discounts).
The Company evaluates inventory shortages throughout the year based on actual physical counts in its facilities. Allowances for inventory shortages are recorded based on the results of these counts to provide for estimated shortages as of the financial statement date.
A-37
Notes to Consolidated Financial Statements, Continued
Property, Plant and Equipment
Property, plant and equipment are recorded at cost or, in the case of assets acquired in a business combination, at fair value. Depreciation and amortization expense, which includes the amortizationdepreciation of assets recorded under capital leases, is computed principally using the straight-line method over the estimated useful lives of individual assets. Buildings and land improvements are depreciated based on lives varying from 10 to 40 years. All new purchases of store equipment are assigned lives varying from three to nine years. Leasehold improvements are amortized over the shorter of the lease term to which they relate, which generally varies from four to 25 years, or the useful life of the asset. ManufacturingFood production plant and distribution center equipment is depreciated over lives varying from three to 15 years. Information technology assets are generally depreciated over five years. Depreciation and amortization expense was $2,089 in 2015, $1,948 in 2014 and $1,703 in 2013, $1,652 in 2012 and $1,638 in 2011.2013.
Interest costs on significant projects constructed for the Company’s own use are capitalized as part of the costs of the newly constructed facilities. Upon retirement or disposal of assets, the cost and related accumulated depreciation and amortization are removed from the balance sheet and any gain or loss is reflected in net earnings. Refer to Note 4 for further information regarding the Company’s property, plant and equipment.
Deferred Rent
The Company recognizes rent holidays, including the time period during which the Company has access to the property for construction of buildings or improvements and escalating rent provisions on a straight-line basis over the term of the lease. The deferred amount is included in Other Current Liabilities“Other current liabilities” and Other Long-Term Liabilities“Other long-term liabilities” on the Company’s Consolidated Balance Sheets.
Goodwill
The Company reviews goodwill for impairment during the fourth quarter of each year, and also upon the occurrence of trigger events.a triggering event. The Company performs reviews of each of its operating divisions and variable interest entities (collectively, our reporting units)“reporting units”) that have goodwill balances. Generally, fair value is determined using a multiple of earnings, or discounted projected future cash flows, and is compared to the carrying value of a divisionreporting unit for purposes of identifying potential impairment. Projected future cash flows are based on management’s knowledge of the current operating environment and expectations for the future. If potential for impairment is identified, the fair value of a divisionreporting unit is measured against the fair value of its underlying assets and liabilities, excluding goodwill, to estimate an implied fair value of the division’sreporting unit’s goodwill. Goodwill impairment is recognized for any excess of the carrying value of the division’sreporting unit’s goodwill over the implied fair value. Results of the goodwill impairment reviews performed during 2013, 20122015, 2014 and 20112013 are summarized in Note 3 to the Consolidated Financial Statements.3.
A-37
Impairment of Long-Lived Assets
The Company monitors the carrying value of long-lived assets for potential impairment each quarter based on whether certain triggertriggering events have occurred. These events include current period losses combined with a history of losses or a projection of continuing losses or a significant decrease in the market value of an asset. When a triggertriggering event occurs, an impairment calculation is performed, comparing projected undiscounted future cash flows, utilizing current cash flow information and expected growth rates related to specific stores, to the carrying value for those stores. If the Company identifies impairment for long-lived assets to be held and used, the Company compares the assets’ current carrying value to the assets’ fair value. Fair value is based on current market values or discounted future cash flows. The Company records impairment when the carrying value exceeds fair market value. With respect to owned property and equipment held for sale,disposal, the value of the property and equipment is adjusted to reflect recoverable values based on previous efforts to dispose of similar assets and current economic conditions. Impairment is recognized for the excess of the carrying value over the estimated fair market value, reduced by estimated direct costs of disposal. The Company recorded asset impairments in the normal course of business totaling $46, $37 and $39 $18in 2015, 2014 and $37 in 2013, 2012 and 2011, respectively. Costs to reduce the carrying value of long-lived assets for each of the years presented have been included in the Consolidated Statements of Operations as “Operating, general and administrative” expense.
A-38
Notes to Consolidated Financial Statements, Continued
Store Closing Costs
The Company provides for closed store liabilities relating to the present value of the estimated remaining non-cancellable lease payments after the closing date, net of estimated subtenant income. The Company estimates the net lease liabilities using a discount rate to calculate the present value of the remaining net rent payments on closed stores. The closed store lease liabilities usually are paid over the lease terms associated with the closed stores, which generally have remaining terms ranging from one to 20 years. Adjustments to closed store liabilities primarily relate to changes in subtenant income and actual exit costs differing from original estimates. Adjustments are made for changes in estimates in the period in which the change becomes known. Store closing liabilities are reviewed quarterly to ensure that any accrued amount that is not a sufficient estimate of future costs or that no longer is needed for its originally intended purpose, is adjusted to income in the proper period.
Owned stores held for disposal are reduced to their estimated net realizable value. Costs to reduce the carrying values of property, equipment and leasehold improvements are accounted for in accordance with the Company’s policy on impairment of long-lived assets. Inventory write-downs, if any, in connection with store closings, are classified in the Consolidated Statements of Operations as “Merchandise costs.” Costs to transfer inventory and equipment from closed stores are expensed as incurred.
The following table summarizes accrual activity forcurrent portion of the future lease obligations of stores that were closedis included in “Other current liabilities,” and the long-term portion is included in “Other long-term liabilities” in the normal course of business and assumed in the merger with Harris Teeter Supermarkets, Inc. (“Harris Teeter”):Consolidated Balance Sheets.
| Future Lease | |||||
| Obligations | |||||
| Balance at January 28, 2012 | $ | 55 | |||
| Additions | 6 | ||||
| Payments | (10 | ) | |||
| Other | (7 | ) | |||
| Balance at February 2, 2013 | 44 | ||||
| Additions | 7 | ||||
| Payments | (9 | ) | |||
| Other | (2 | ) | |||
| Assumed from Harris Teeter | 18 | ||||
| Balance at February 1, 2014 | $ | 58 | |||
Interest Rate Risk Management
The Company uses derivative instruments primarily to manage its exposure to changes in interest rates. The Company’s current program relative to interest rate protection and the methods by which the Company accounts for its derivative instruments are described in Note 7.
Commodity Price Protection
The Company enters into purchase commitments for various resources, including raw materials utilized in its manufacturing facilitiesfood production plants and energy to be used in its stores, manufacturing facilitiesfood production plants and administrative offices. The Company enters into commitments expecting to take delivery of and to utilize those resources in the conduct of the normal course of business. The Company’s current program relative to commodity price protection and the methods by which the Company accounts for its purchase commitments are described in Note 7.
A-39A-38
Notes to Consolidated Financial Statements, Continued
Benefit Plans and Multi-Employer Pension Plans
The Company recognizes the funded status of its retirement plans on the Consolidated Balance Sheet.Sheets. Actuarial gains or losses, prior service costs or credits and transition obligations that have not yet been recognized as part of net periodic benefit cost are required to be recorded as a component of Accumulated Other Comprehensive Income (“AOCI”). All plans are measured as of the Company’s fiscal year end.
The determination of the obligation and expense for Company-sponsored pension plans and other post-retirement benefits is dependent on the selection of assumptions used by actuaries and the Company in calculating those amounts. Those assumptions are described in Note 15 and include, among others, the discount rate, the expected long-term rate of return on plan assets, mortality and the rates of increase in compensation and health care costs. Actual results that differ from the assumptions are accumulated and amortized over future periods and, therefore, generally affect the recognized expense and recorded obligation in future periods. While the Company believes that the assumptions are appropriate, significant differences in actual experience or significant changes in assumptions may materially affect the pension and other post-retirement obligations and future expense.
The Company also participates in various multi-employer plans for substantially all union employees. Pension expense for these plans is recognized as contributions are funded. Refer to Note 16 for additional information regarding the Company’s participation in these various multi-employer plans and the United Food and Commercial Workers International Union (“UFCW”) consolidated fund.plans.
The Company administers and makes contributions to the employee 401(k) retirement savings accounts. Contributions to the employee 401(k) retirement savings accounts are expensed when contributed. Refer to Note 15 for additional information regarding the Company’s benefit plans.
StockShare Based Compensation
The Company accounts for stock options under fair value recognition provisions. Under this method, the Company recognizes compensation expense for all share-based payments granted. The Company recognizes share-based compensation expense, net of an estimated forfeiture rate, over the requisite service period of the award. In addition, the Company records expense for restricted stock awards in an amount equal to the fair market value of the underlying stock on the grant date of the award, over the period the awards lapse. Refer to Note 12 for additional information regarding the Company’s stock based compensation.
Deferred Income Taxes
Deferred income taxes are recorded to reflect the tax consequences of differences between the tax basis of assets and liabilities and their financial reporting basis. Refer to Note 5 for the types of differences that give rise to significant portions of deferred income tax assets and liabilities. Deferred income taxes are classified as a net current or noncurrent asset or liability based on the classification of the related asset or liability for financial reporting purposes. A deferred tax asset or liability that is not related to an asset or liability for financial reporting is classified according to the expected reversal date.
Uncertain Tax Positions
The Company reviews the tax positions taken or expected to be taken on tax returns to determine whether and to what extent a benefit can be recognized in its consolidated financial statements. Refer to Note 5 for the amount of unrecognized tax benefits and other related disclosures related to uncertain tax positions.
A-39
Various taxing authorities periodically audit the Company’s income tax returns. These audits include questions regarding the Company’s tax filing positions, including the timing and amount of deductions and the allocation of income to various tax jurisdictions. In evaluating the exposures connected with these various tax filing positions, including state and local taxes, the Company records allowances for probable exposures. A number of years may elapse before a particular matter, for which an allowance has been established, is audited and fully resolved. As of February 1, 2014,January 30, 2016, the Internal Revenue Service had concluded its field examination of
A-40
Notes to Consolidated Financial Statements, Continued
the Company’s 20082010 and 20092011 federal tax returns. The Company has filed an administrative appeal with the Internal Revenue Service protesting certain adjustments proposed by the Internal Revenue Service as a result of their field work.Tax years 2012 and 2013 remain under examination.
The assessment of the Company’s tax position relies on the judgment of management to estimate the exposures associated with the Company’s various filing positions.
Self-Insurance Costs
The Company is primarily self-insured for costs related to workers’ compensation and general liability claims. Liabilities are actuarially determined and are recognized based on claims filed and an estimate of claims incurred but not reported. The liabilities for workers’ compensation claims are accounted for on a present value basis. The Company has purchased stop-loss coverage to limit its exposure to any significant exposure on a per claim basis. The Company is insured for covered costs in excess of these per claim limits.
The following table summarizes the changes in the Company’s self-insurance liability through February 1, 2014.January 30, 2016.
| 2013 | 2012 | 2011 | 2015 | 2014 | 2013 | |||||||||||||||||||
| Beginning balance | $ | 537 | $ | 529 | $ | 514 | $ | 599 | $ | 569 | $ | 537 | ||||||||||||
| Expense | 220 | 215 | 215 | 234 | 246 | 220 | ||||||||||||||||||
| Claim payments | (215 | ) | (207 | ) | (200 | ) | (225 | ) | (216 | ) | (215 | ) | ||||||||||||
| Assumed from Harris Teeter | 27 | — | — | |||||||||||||||||||||
| Assumed from Roundy’s or Harris Teeter | 31 | — | 27 | |||||||||||||||||||||
| Ending balance | 569 | 537 | 529 | 639 | 599 | 569 | ||||||||||||||||||
| Less: Current portion | (224 | ) | (205 | ) | (197 | ) | (223 | ) | (213 | ) | (224 | ) | ||||||||||||
| Long-term portion | $ | 345 | $ | 332 | $ | 332 | $ | 416 | $ | 386 | $ | 345 | ||||||||||||
The current portion of the self-insured liability is included in “Other current liabilities,” and the long-term portion is included in “Other long-term liabilities” in the Consolidated Balance Sheets.
The Company maintains surety bonds related to self-insured workers’ compensation claims. These bonds are required by most states in which the Company is self-insured for workers’ compensation and are placed with third-party insurance providers to insure payment of ourthe Company’s obligations in the event the Company is unable to meet its claim payment obligations up to its self-insured retention levels. These bonds do not represent liabilities of the Company, as the Company has recorded reserves for the claim costs.
The Company is similarly self-insured for property-related losses. The Company maintains stop loss coverage to limit its property loss exposures including coverage for earthquake, wind, flood and other catastrophic events.
A-40
Revenue Recognition
Revenues from the sale of products are recognized at the point of sale. Discounts provided to customers by the Company at the time of sale, including those provided in connection with loyalty cards, are recognized as a reduction in sales as the products are sold. Discounts provided by vendors, usually in the form of paper coupons, are not recognized as a reduction in sales provided the coupons are redeemable at any retailer that accepts coupons. The Company records a receivable from the vendor for the difference in sales price and cash received. Pharmacy sales are recorded when product is provided to the customer. Sales taxes are recorded as other accrued liabilities and not as a component of sales. The Company does not recognize a sale when it sells its own gift cards and gift certificates. Rather, it records a deferred liability equal to the amount received. A sale is then recognized when the gift card or gift certificate is redeemed to purchase the Company’s products. Gift card and certificate breakage is recognized when redemption is deemed remote and there is no legal obligation to remit the value of the unredeemed gift card. The amount of breakage has not been material for 2013, 20122015, 2014 and 2011.2013.
A-41
Notes to Consolidated Financial Statements, Continued
Merchandise Costs
The “Merchandise costs” line item of the Consolidated Statements of Operations includes product costs, net of discounts and allowances; advertising costs (see separate discussion below); inbound freight charges; warehousing costs, including receiving and inspection costs; transportation costs; and manufacturingfood production and operational costs. Warehousing, transportation and manufacturing management salaries are also included in the “Merchandise costs” line item; however, purchasing management salaries and administration costs are included in the “Operating, general and administrative” line item along with most of the Company’s other managerial and administrative costs. Rent expense and depreciation and amortization expense are shown separately in the Consolidated Statements of Operations.
Warehousing and transportation costs include distribution center direct wages, transportation direct wages, repairs and maintenance, utilities, inbound freight and, where applicable, third party warehouse management fees, as well as transportation direct wages and repairs and maintenance.fees. These costs are recognized in the periods the related expenses are incurred.
The Company believes the classification of costs included in merchandise costs could vary widely throughout the industry. The Company’s approach is to include in the “Merchandise costs” line item the direct, net costs of acquiring products and making them available to customers in its stores. The Company believes this approach most accurately presents the actual costs of products sold.
The Company recognizes all vendor allowances as a reduction in merchandise costs when the related product is sold. When possible, vendor allowances are applied to the related product cost by item and, therefore, reduce the carrying value of inventory by item. When the items are sold, the vendor allowance is recognized. When it is not possible, due to systems constraints, to allocate vendor allowances to the product by item, vendor allowances are recognized as a reduction in merchandise costs based on inventory turns and, therefore, recognized as the product is sold.
Advertising Costs
The Company’s advertising costs are recognized in the periods the related expenses are incurred and are included in the “Merchandise costs” line item of the Consolidated Statements of Operations. The Company’s pre-tax advertising costs totaled $679 in 2015, $648 in 2014 and $587 in 2013, $553 in 2012 and $532 in 2011.2013. The Company does not record vendor allowances for co-operative advertising as a reduction of advertising expense.
Cash, Temporary Cash Investments and Book Overdrafts
Cash and temporary cash investments represent store cash and short-term investments with original maturities of less than three months. Book overdrafts are included in trade accounts payable and accrued salaries and wages.
Deposits In-Transit
Deposits in-transit generally represent funds deposited to the Company’s bank accounts at the end of the year related to sales, a majority of which were paid for with debit cards, credit cards and checks, to which the Company does not have immediate access but that settle within a few days of the sales transaction.
Consolidated Statements of Cash Flows
For purposes of the Consolidated Statements of Cash Flows, the Company considers all highly liquid debt instruments purchased with an original maturity of three months or less to be temporary cash investments.
A-42A-41
Notes to Consolidated Financial Statements, ContinuedSegments
Segments
The Company operates retail food and drug stores, multi-department stores, jewelry stores, and convenience stores throughout the United States. The Company’s retail operations, which represent over 99% of the Company’s consolidated sales and EBITDA, are its only reportable segment. The Company’s retail operating divisions have been aggregated into one reportable segment due to the operating divisions having similar economic characteristics with similar long-term financial performance. In addition, the Company’s operating divisions offer to its customers similar products, have similar distribution methods, operate in similar regulatory environments, purchase the majority of the Company’s merchandise for retail sale from similar (and in many cases identical) vendors on a coordinated basis from a centralized location, serve similar types of customers, and are allocated capital from a centralized location. The Company’s operating divisions reflect the manner in which the business is managed and how the Company’s Chief Executive Officer, and Chief Operating Officer, who actacts as the Company’s chief operating decision makers,maker, assess performance internally. All of the Company’s operations are domestic.
The following table presents sales revenue by type of product for 2013, 20122015, 2014 and 2011.2013.
| 2013 | 2012 | 2011 | 2015 | 2014 | 2013 | ||||||||||||||||||||||||||||||||||
| Amount | % of total | Amount | % of total | Amount | % of total | Amount | % of total | Amount | % of total | Amount | % of total | ||||||||||||||||||||||||||||
| Non Perishable (1) | $ | 49,229 | 50.0 | % | $ | 48,663 | 50.4 | % | $ | 46,494 | 51.5 | % | $ | 57,187 | 52.1% | $ | 54,392 | 50.1% | $ | 49,229 | 50.0% | ||||||||||||||||||
| Perishable (2) | 20,625 | 21.0 | % | 19,761 | 20.5 | % | 18,588 | 20.6 | % | 25,726 | 23.4% | 24,178 | 22.3% | 20,625 | 21.0% | ||||||||||||||||||||||||
| Fuel | 18,962 | 19.3 | % | 18,896 | 19.5 | % | 16,901 | 18.7 | % | 14,802 | 13.5% | 18,850 | 17.4% | 18,962 | 19.3% | ||||||||||||||||||||||||
| Pharmacy | 8,073 | 8.2 | % | 8,018 | 8.3 | % | 7,322 | 8.1 | % | 9,778 | 8.9% | 9,032 | 8.3% | 8,073 | 8.2% | ||||||||||||||||||||||||
| Other (3) | 1,486 | 1.5 | % | 1,281 | 1.3 | % | 964 | 1.1 | % | 2,337 | 2.1% | 2,013 | 1.9% | 1,486 | 1.5% | ||||||||||||||||||||||||
| Total Sales and other revenue | $ | 98,375 | 100.0 | % | $ | 96,619 | 100.0 | % | $ | 90,269 | 100.0 | % | $ | 109,830 | 100.0% | $ | 108,465 | 100.0% | $ | 98,375 | 100.0% | ||||||||||||||||||
| (1) | Consists primarily of grocery, general merchandise, health and beauty care and natural foods. | |||
| (2) | Consists primarily of produce, floral, meat, seafood, deli, bakery and | |||
| (3) | Consists primarily of sales related to jewelry | |||
2. MergerMergers
On January 28, 2014,December 18, 2015, the Company closed its merger with Harris TeeterRoundy’s by purchasing 100% of the Harris TeeterRoundy’s outstanding common stock for $2,436.$3.60 per share and assuming Roundy’s outstanding debt, for a purchase price of $866. The merger allows us to expand intobrings a complementary store base in communities throughout Wisconsin and a stronger presence in the fast-growing southeastern and mid-Atlantic markets and into Washington, D.C.greater Chicagoland area. The merger was accounted for under the purchase method of accounting and was financed through a combination of commercial paper and long-term debt (see Note 6). In a business combination, the purchase price is allocated to assets acquired and liabilities assumed based on their fair values, with any excess of purchase price over fair value recognized as goodwill. In addition to recognizing the assets and liabilities on the acquired company’s balance sheet, the Company reviews supply contracts, leases, financial instruments, employment agreements and other significant agreements to identify potential assets or liabilities that require recognition in connection with the application of acquisition accounting under ASCAccounting Standards Codification (“ASC”) 805. Intangible assets are recognized apart from goodwill when the asset arises from contractual or other legal rights, or are separable from the acquired entity such that they may be sold, transferred, licensed, rented or exchanged either on a standalone basis or in combination with a related contract, asset or liability.
A-43A-42
Notes to Consolidated Financial Statements, Continued
Pending the finalization of the Company’s valuationsvaluation and other items, the following table summarizes the preliminary fair values of the assets acquired and liabilities assumed:assumed as part of the merger with Roundy’s:
| January 28, | ||||||||||||
| 2014 | December 18, 2015 | |||||||||||
| ASSETS | ||||||||||||
| Cash and temporary cash investments | $ | 92 | $ | 20 | ||||||||
| Store deposits in-transit | 28 | 30 | ||||||||||
| Receivables | 41 | 43 | ||||||||||
| FIFO inventory | 426 | 323 | ||||||||||
| Prepaid and other current assets | 31 | 19 | ||||||||||
| Total current assets | 618 | 435 | ||||||||||
| Property, plant and equipment | 1,328 | 342 | ||||||||||
| Intangibles | 558 | 324 | ||||||||||
| Other assets | 238 | 4 | ||||||||||
| Total Assets, excluding Goodwill | 2,742 | 1,105 | ||||||||||
| LIABILITIES | ||||||||||||
| Current portion of long-term debt including obligations under | ||||||||||||
| capital leases and financing obligations | (7 | ) | ||||||||||
| Current portion of obligations under capital leases and financing obligations | (9 | ) | ||||||||||
| Trade accounts payable | (202 | ) | (236 | ) | ||||||||
| Accrued salaries and wages | (47 | ) | (40 | ) | ||||||||
| Deferred income taxes | (20 | ) | ||||||||||
| Other current liabilities | (159 | ) | (89 | ) | ||||||||
| Total current liabilities | (435 | ) | (374 | ) | ||||||||
| Fair-value of long-term debt including obligations under | ||||||||||||
| capital leases and financing obligations | (252 | ) | ||||||||||
| Fair-value of long-term debt | (678 | ) | ||||||||||
| Fair-value of long-term obligations under capital leases and financing obligations | (20 | ) | ||||||||||
| Deferred income taxes | (285 | ) | (112 | ) | ||||||||
| Pension and postretirement benefit obligations | (98 | ) | (36 | ) | ||||||||
| Other long-term liabilities | (137 | ) | (111 | ) | ||||||||
| Total Liabilities | (1,207 | ) | (1,331 | ) | ||||||||
| Total Identifiable Net Assets | 1,535 | |||||||||||
| Total Identifiable Net Liabilities | (226 | ) | ||||||||||
| Goodwill | 901 | 414 | ||||||||||
| Total Purchase Price | $ | 2,436 | $ | 188 | ||||||||
Of the $558$324 allocated to intangible assets, $430$211 relates to the Harris TeeterMariano’s, Pick ’n Save, Metro Market and Copps trade name,names, to which we assigned an indefinite life and, therefore, will not be amortized. The Company also recorded $53$69, $38, and $75$6 related to favorable leasehold interests, pharmacy prescription files and customer lists, respectively. The Company will amortize the favorable leasehold interests respectively.over a weighted average of twelve years. The Company will amortize the pharmacy prescription files and favorable leasehold interestscustomer lists over seven and 24two years, respectively. The goodwill recorded as part of the merger was attributable to the assembled workforce of Harris TeeterRoundy’s and operational synergies expected from the merger, as well as any intangible assets that do not qualify for separate recognition. The transaction was treated as a stock purchase for income tax purposes. The assets acquired and liabilities assumed as part of the merger did not result in a step up of the tax basis and goodwill is not expected to be deductible for tax purposes. The above amounts represent the preliminary allocation of the purchase price, and are subject to revision when the resulting valuations of property and intangible assets are finalized, which will occur prior to January 28, 2015.December 18, 2016. Due to the timing of the merger closing late in the year, the revenue and earnings of Harris TeeterRoundy’s in 20132015 were not material.
A-44A-43
NotesOn August 18, 2014, the Company closed its merger with Vitacost.com, Inc. (“Vitacost.com”) by purchasing 100% of the Vitacost.com outstanding common stock for $8.00 per share or $287. This merger affords the Company access to Consolidated Financial Statements, ContinuedVitacost.com’s extensive e-commerce platform, which can be combined with the Company’s customer insights and loyal customer base, to create new levels of personalization and convenience for customers. The merger was accounted for under the purchase method of accounting and was financed through the issuance of commercial paper (see Note 6).
The Company’s purchase price allocation was finalized in the second quarter of 2015. The changes in the fair values assumed from the preliminary amounts were not material. The table below summarizes the final fair values of the assets acquired and liabilities assumed:
| August 18, 2014 | ||||||
| ASSETS | ||||||
| Total current assets | $ | 80 | ||||
| Property, plant and equipment | 28 | |||||
| Intangibles | 81 | |||||
| Total Assets, excluding Goodwill | 189 | |||||
| LIABILITIES | ||||||
| Total current liabilities | (56 | ) | ||||
| Deferred income taxes | (6 | ) | ||||
| Total Liabilities | (62 | ) | ||||
| Total Identifiable Net Assets | 127 | |||||
| Goodwill | 160 | |||||
| Total Purchase Price | $ | 287 | ||||
Of the $81 allocated to intangible assets, the Company recorded $49, $26 and $6 related to customer relationships, technology and the trade name, respectively. The Company will amortize the technology and the trade name, using the straight line method, over 10 and three years, respectively, while the customer relationships will be amortized over five years using the declining balance method. The goodwill recorded as part of the merger was attributable to the assembled workforce of Vitacost.com and operational synergies expected from the merger, as well as any intangible assets that did not qualify for separate recognition. The transaction was treated as a stock purchase for income tax purposes. The assets acquired and liabilities assumed as part of the merger did not result in a step up of the tax basis and goodwill is not expected to be deductible for tax purposes.
Pro forma results of operations, assuming the Harris Teeter Supermarkets, Inc. (“Harris Teeter”) merger had taken place at the beginning of 2012, the Vitacost.com merger had taken place at the beginning of 2013 and the Roundy’s transaction had taken place at the beginning of 2012,2014, are included in the following table. The pro forma information includes historical results of operations of Harris Teeter, Vitacost.com and Roundy’s, as well as adjustments for interest expense that would have been incurred due to financing the acquisition,mergers, depreciation and amortization of the assets acquired and excludes the pre-acquisitionpre-merger transaction related expenses incurred by Harris Teeter, Vitacost.com, Roundy’s and the Company. The pro forma information does not include efficiencies, cost reductions, synergies andor investments in lower prices for our customers expected to result from the merger or immaterial acquisitions completed in 2012.mergers. The unaudited pro
A-44
forma financial information is not necessarily indicative of the results that actually would have occurred had the Harris Teeter merger been completed at the beginning of 2012, the 2012.Vitacost.com merger completed at the beginning of 2013 or the Roundy’s merger completed at the beginning of 2014.
| Fiscal year ended | Fiscal year ended | ||||||||||||||||||||||||
| February 1, 2014 | February 2, 2013 | Fiscal year ended January 30, 2016 | Fiscal year ended January 31, 2015 | Fiscal year ended February 1, 2014 | |||||||||||||||||||||
| Sales | $ | 103,202 | $ | 101,214 | $ | 113,308 | $ | 112,458 | $ | 103,584 | |||||||||||||||
| Net earnings including noncontrolling interests | 1,664 | 1,584 | 2,061 | 1,751 | 1,624 | ||||||||||||||||||||
| Net earnings attributable to noncontrolling interests | 12 | 11 | 10 | 19 | 12 | ||||||||||||||||||||
| Net earnings attributable to The Kroger Co. | $ | 1,652 | $ | 1,573 | $ | 2,051 | $ | 1,732 | $ | 1,612 | |||||||||||||||
3. Goodwill and Intangible Assets
The following table summarizes the changes in the Company’s net goodwill balance through February 1, 2014.January 30, 2016.
| 2013 | 2012 | |||||||
| Balance beginning of year | ||||||||
| Goodwill | $ | 3,766 | $ | 3,670 | ||||
| Accumulated impairment losses | (2,532 | ) | (2,532 | ) | ||||
| 1,234 | 1,138 | |||||||
| Activity during the year | ||||||||
| Acquisitions | 901 | 96 | ||||||
| Balance end of year | ||||||||
| Goodwill | 4,667 | 3,766 | ||||||
| Accumulated impairment losses | (2,532 | ) | (2,532 | ) | ||||
| $ | 2,135 | $ | 1,234 | |||||
| 2015 | 2014 | ||||||||
| Balance beginning of year | |||||||||
| Goodwill | $ | 4,836 | $ | 4,667 | |||||
| Accumulated impairment losses | (2,532 | ) | (2,532 | ) | |||||
| 2,304 | 2,135 | ||||||||
| Activity during the year | |||||||||
| Mergers | 420 | 169 | |||||||
| Balance end of year | |||||||||
| Goodwill | 5,256 | 4,836 | |||||||
| Accumulated impairment losses | (2,532 | ) | (2,532 | ) | |||||
| $ | 2,724 | $ | 2,304 | ||||||
In 2013,2015, the Company acquired all the outstanding shares of Harris Teeter,Roundy’s, a supermarket retailer in southeasternthe Wisconsin and mid-AtlanticChicagoland markets, and Washington, D.C.,resulting in additional goodwill totaling $414. Roundy’s is accounted for as a single reporting unit.
In 2014, the Company acquired all the outstanding shares of Vitacost.com, an online retailer, resulting in additional goodwill of $901. $160.
See Note 2 for additional information regarding the merger.Roundy’s and Vitacost.com mergers.
In 2012, the Company acquired an interest in one of its suppliers and all the outstanding shares of Axium Pharmacy, a leading specialty pharmacy that provides specialized drug therapies and support services for patients with complex medical conditions, resulting in combined additional goodwill of $96.
Testing for impairment must be performed annually, or on an interim basis upon the occurrence of a triggering event or a change in circumstances that would more likely than not reduce the fair value of a reporting unit below its carrying amount. The annual evaluationevaluations of goodwill and indefinite-lived intangible assets were performed during the fourth quarter of 2013, 20122015, 2014 and 20112013 did not result in impairment.
Based on current and future expected cash flows, the Company believes goodwill impairments are not reasonably likely. A 10% reduction in fair value of the Company’s reporting units would not indicate a potential for impairment of the Company’s remaining goodwill balance.
A-45
Notes to Consolidated Financial Statements, Continued
TheIn 2015, the Company acquired definite and indefinite lived intangible assets totaling approximately $558$324 as a result of the merger with Harris Teeter. See Note 2 for additional information regardingRoundy’s.
In 2014, the merger.Company acquired definite and indefinite lived intangible assets totaling approximately $81 as a result of the merger with Vitacost.com.
A-45
The following table summarizes the Company’s intangible assets balance through February 1, 2014.January 30, 2016.
| 2013 | 2012 | |||||||||||||||||||||||||||||||||||||||||||
| Gross carrying | Accumulated | Gross carrying | Accumulated | 2015 | 2014 | |||||||||||||||||||||||||||||||||||||||
| amount | amortization (1) | amount | amortization (1) | Gross carrying amount | Accumulated | Gross carrying amount | Accumulated amortization(1) | |||||||||||||||||||||||||||||||||||||
| Definite-lived favorable leasehold interests | $ | 144 | $ | (61 | ) | $ | 69 | $ | (58 | ) | $ | 169 | $ | (31 | ) | $ | 101 | $ | (26 | ) | ||||||||||||||||||||||||
| Definite-lived pharmacy prescription files | 95 | (28 | ) | 45 | (26 | ) | 127 | (40 | ) | 98 | (41 | ) | ||||||||||||||||||||||||||||||||
| Definite-lived customer relationships | 93 | (39 | ) | 87 | (17 | ) | ||||||||||||||||||||||||||||||||||||||
| Definite-lived other | 78 | (10 | ) | 54 | (2 | ) | 78 | (23 | ) | 74 | (13 | ) | ||||||||||||||||||||||||||||||||
| Indefinite-lived trade name | 430 | — | — | — | 641 | — | 430 | — | ||||||||||||||||||||||||||||||||||||
| Indefinite-lived liquor licenses | 54 | — | 48 | — | 78 | — | 64 | — | ||||||||||||||||||||||||||||||||||||
| Total | $ | 801 | $ | (99 | ) | $ | 216 | $ | (86 | ) | $ | 1,186 | $ | (133 | ) | $ | 854 | $ | (97 | ) | ||||||||||||||||||||||||
| (1) | Favorable leasehold interests are amortized to rent expense, pharmacy prescription files are amortized to merchandise costs, customer relationships are amortized to depreciation and amortization expense and other intangibles are amortized to operating, general and administrative (“OG&A”) expense and depreciation and amortization expense. |
Amortization expense associated with intangible assets totaled approximately $18, $13$51, $41 and $12,$18, during fiscal years 2013, 20122015, 2014 and 2011,2013, respectively. Future amortization expense associated with the net carrying amount of definite-lived intangible assets for the years subsequent to 20132015 is estimated to be approximately:
| 2014 | $ | 28 | ||||
| 2015 | 25 | |||||
| 2016 | 22 | $ | 57 | |||
| 2017 | 21 | 48 | ||||
| 2018 | 20 | 42 | ||||
| 2019 | 40 | |||||
| 2020 | 35 | |||||
| Thereafter | 102 | 112 | ||||
| Total future estimated amortization associated | ||||||
| with definite-lived intangible assets | $ | 218 | $ | 334 | ||
4. Property, Plant and Equipment, Net
Property, plant and equipment, net consists of:
| 2013 | 2012 | |||||||
| Land | $ | 2,639 | $ | 2,450 | ||||
| Buildings and land improvements | 8,848 | 8,249 | ||||||
| Equipment | 11,037 | 10,267 | ||||||
| Leasehold improvements | 7,644 | 6,545 | ||||||
| Construction-in-progress | 1,520 | 1,239 | ||||||
| Leased property under capital leases and financing obligations | 691 | 593 | ||||||
| Total property, plant and equipment | 32,379 | 29,343 | ||||||
| Accumulated depreciation and amortization | (15,486 | ) | (14,495 | ) | ||||
| Property, plant and equipment, net | $ | 16,893 | $ | 14,848 | ||||
| 2015 | 2014 | ||||||||
| Land | $ | 2,997 | $ | 2,819 | |||||
| Buildings and land improvements | 10,524 | 9,639 | |||||||
| Equipment | 12,520 | 11,587 | |||||||
| Leasehold improvements | 8,710 | 8,068 | |||||||
| Construction-in-progress | 2,115 | 1,690 | |||||||
| Leased property under capital leases and financing obligations | 801 | 737 | |||||||
| Total property, plant and equipment | 37,667 | 34,540 | |||||||
| Accumulated depreciation and amortization | (18,048 | ) | (16,628 | ) | |||||
| Property, plant and equipment, net | $ | 19,619 | $ | 17,912 | |||||
Accumulated depreciation and amortization for leased property under capital leases was $339$293 at February 1, 2014January 30, 2016 and $321$332 at February 2, 2013.
Approximately $232 and $236, original cost, of Property, Plant and Equipment collateralized certain mortgages at February 1, 2014 and February 2, 2013, respectively.January 31, 2015.
A-46
Notes to Consolidated Financial Statements, ContinuedApproximately $264 and $260, net book value, of property, plant and equipment collateralized certain mortgages at January 30, 2016 and January 31, 2015, respectively.
5. Taxes Based on IncomeTAXES BASEDON INCOME
The provision for taxes based on income consists of:
| 2013 | 2012 | 2011 | ||||||||||
| Federal | ||||||||||||
| Current | $ | 638 | $ | 563 | $ | 146 | ||||||
| Deferred | 81 | 154 | 78 | |||||||||
| Subtotal federal | 719 | 717 | 224 | |||||||||
| State and local | ||||||||||||
| Current | 42 | 46 | 42 | |||||||||
| Deferred | (10 | ) | 31 | (19 | ) | |||||||
| Subtotal state and local | 32 | 77 | 23 | |||||||||
| Total | $ | 751 | $ | 794 | $ | 247 | ||||||
| 2015 | 2014 | 2013 | |||||||||
| Federal | |||||||||||
| Current | $ | 723 | $ | 847 | $ | 638 | |||||
| Deferred | 266 | (15 | ) | 81 | |||||||
| Subtotal federal | 989 | 832 | 719 | ||||||||
| State and local | |||||||||||
| Current | 37 | 59 | 42 | ||||||||
| Deferred | 19 | 11 | (10 | ) | |||||||
| Subtotal state and local | 56 | 70 | 32 | ||||||||
| Total | $ | 1,045 | $ | 902 | $ | 751 | |||||
A reconciliation of the statutory federal rate and the effective rate follows:
| 2013 | 2012 | 2011 | |||||||
| Statutory rate | 35.0 | % | 35.0 | % | 35.0 | % | |||
| State income taxes, net of federal tax benefit | 0.9 | % | 2.2 | % | 1.8 | % | |||
| Credits | (1.3 | )% | (1.4 | )% | (3.6 | )% | |||
| Favorable resolution of issues | — | (0.5 | )% | (3.4 | )% | ||||
| Domestic manufacturing deduction | (1.1 | )% | (0.5 | )% | (1.3 | )% | |||
| Other changes, net | (0.6 | )% | (0.3 | )% | 0.8 | % | |||
| 32.9 | % | 34.5 | % | 29.3 | % | ||||
| 2015 | 2014 | 2013 | |||||||
| Statutory rate | 35.0 | % | 35.0 | % | 35.0 | % | |||
| State income taxes, net of federal tax benefit | 1.2 | % | 1.7 | % | 0.9 | % | |||
| Credits | (1.2 | )% | (1.2 | )% | (1.3 | )% | |||
| Favorable resolution of issues | (0.2 | )% | (0.4 | )% | — | % | |||
| Domestic manufacturing deduction | (0.7 | )% | (0.7 | )% | (1.1 | )% | |||
| Other changes, net | (0.3 | )% | (0.3 | )% | (0.6 | )% | |||
| 33.8 | % | 34.1 | % | 32.9 | % | ||||
The 20132015 effective tax rate differed from the federal statutory rate primarily as a result of the utilization of tax credits, the Domestic Manufacturing Deduction and other changes, partially offset by the effect of state income taxes. The 2015 rate for state income taxes is lower than 2014 due to the filing of amended returns to claim additional benefits in years still under review, the favorable resolution of state issues and an increase in state credits. The 2013 rate for state income taxes is lower than 20122015 and 20112014 due to an increase in state credits, including the benefit from filing amended returns to claim additional credits. The 2013 benefit from the Domestic Manufacturing Deduction increased from 2012is greater than 2015 and 2014 due to additional deductions taken in 2013, as well as the amendment of prior years’ tax returns to claim the additional benefit available in years still under review by the Internal Revenue Service. The 2011 effective tax rate was significantly lower than 2013 and 2012 due to the effect on pre-tax income of the UFCW consolidated pension plan charge of $953 ($591 after-tax) in 2011. The effect of the UFCW consolidated pension plan charge reduced pre-tax income thereby increasing the effect of credits and of the favorable resolution of tax issues on our 2011 effective tax rate.
A-47
Notes to Consolidated Financial Statements, Continued
The tax effects of significant temporary differences that comprise tax balances were as follows:
| 2013 | 2012 | |||||||
| Current deferred tax assets: | ||||||||
| Net operating loss and credit carryforwards | $ | 4 | $ | 4 | ||||
| Compensation related costs | 103 | 79 | ||||||
| Other | 15 | — | ||||||
| Subtotal | 122 | 83 | ||||||
| Valuation allowance | (9 | ) | (4 | ) | ||||
| Total current deferred tax assets | 113 | 79 | ||||||
| Current deferred tax liabilities: | ||||||||
| Insurance related costs | (96 | ) | (116 | ) | ||||
| Inventory related costs | (265 | ) | (234 | ) | ||||
| Other | — | (17 | ) | |||||
| Total current deferred tax liabilities | (361 | ) | (367 | ) | ||||
| Current deferred taxes | $ | (248 | ) | $ | (288 | ) | ||
| Long-term deferred tax assets: | ||||||||
| Compensation related costs | $ | 464 | $ | 564 | ||||
| Lease accounting | 115 | 87 | ||||||
| Closed store reserves | 54 | 56 | ||||||
| Insurance related costs | 66 | 77 | ||||||
| Net operating loss and credit carryforwards | 103 | 82 | ||||||
| Other | — | 2 | ||||||
| Subtotal | 802 | 868 | ||||||
| Valuation allowance | (38 | ) | (28 | ) | ||||
| Total long-term deferred tax assets | 764 | 840 | ||||||
| Long-term deferred tax liabilities: | ||||||||
| Depreciation | (2,128 | ) | (1,636 | ) | ||||
| Other | (17 | ) | — | |||||
| Total long-term deferred tax liabilities | (2,145 | ) | (1,636 | ) | ||||
| Long-term deferred taxes | $ | (1,381 | ) | $ | (796 | ) | ||
| 2015 | 2014 | |||||||
| Current deferred tax assets: | ||||||||
| Net operating loss and credit carryforwards | $ | 10 | $ | 5 | ||||
| Compensation related costs | 83 | 88 | ||||||
| Other | 61 | 14 | ||||||
| Subtotal | 154 | 107 | ||||||
| Valuation allowance | (9 | ) | (7 | ) | ||||
| Total current deferred tax assets | 145 | 100 | ||||||
| Current deferred tax liabilities: | ||||||||
| Insurance related costs | (56 | ) | (99 | ) | ||||
| Inventory related costs | (310 | ) | (288 | ) | ||||
| Total current deferred tax liabilities | (366 | ) | (387 | ) | ||||
| Current deferred taxes | $ | (221 | ) | $ | (287 | ) | ||
| Long-term deferred tax assets: | ||||||||
| Compensation related costs | $ | 709 | $ | 721 | ||||
| Lease accounting | 106 | 129 | ||||||
| Closed store reserves | 57 | 50 | ||||||
| Insurance related costs | 29 | 77 | ||||||
| Net operating loss and credit carryforwards | 128 | 115 | ||||||
| Other | 17 | 2 | ||||||
| Subtotal | 1,046 | 1,094 | ||||||
| Valuation allowance | (43 | ) | (42 | ) | ||||
| Total long-term deferred tax assets | 1,003 | 1,052 | ||||||
| Long-term deferred tax liabilities: | ||||||||
| Depreciation and amortization | (2,755 | ) | (2,261 | ) | ||||
| Total long-term deferred tax liabilities | (2,755 | ) | (2,261 | ) | ||||
| Long-term deferred taxes | $ | (1,752 | ) | $ | (1,209 | ) | ||
On November 19, 2015, the Internal Revenue Service issued implementation guidance for retailers with respect to recently issued tangible property regulations. The adoption of this guidance resulted in the immediate deduction of qualifying costs related to current and prior year store remodels, resulting in an increase in long-term deferred tax liability for depreciation increased overand current income tax receivable. The adoption of this guidance, along with the prior year due toimpact of the inclusion of Harris Teeter and an adjustment to the estimated tax depreciation usedRoundy’s merger, resulted in the 2012 provision that resulted in a correctionincrease in the balance sheet between other current liabilitiesdeferred tax liability related to depreciation and long-term deferred income taxes in 2013. The amount of the correction was not materialamortization from January 31, 2015 to any periods presented.January 30, 2016.
At February 1, 2014,January 30, 2016, the Company had net operating loss carryforwards for state income tax purposes of $1,280.$1,460. These net operating loss carryforwards expire from 20142016 through 2032.2036. The utilization of certain of the Company’s state net operating loss carryforwards may be limited in a given year. Further, based on the analysis described below, the Company has recorded a valuation allowance against some of the deferred tax assets resulting from its state net operating losses.
A-48
At February 1, 2014,January 30, 2016, the Company had state credit carryforwards of $34,$65, most of which expire from 20142016 through 2027. The utilization of certain of the Company’s credits may be limited in a given year. Further, based on the analysis described below, the Company has recorded a valuation allowance against some of the deferred tax assets resulting from its state credits.
A-48
Notes to Consolidated Financial Statements, ContinuedAt January 30, 2016, the Company had federal net operating loss carryforwards of $62. These net operating loss carryforwards expire from 2030 through 2034. The utilization of certain of the Company’s federal net operating loss carryforwards may be limited in a given year. Further, based on the analysis described below, the Company has not recorded a valuation allowance against the deferred tax assets resulting from its federal net operating losses.
The Company regularly reviews all deferred tax assets on a tax filer and jurisdictional basis to estimate whether these assets are more likely than not to be realized based on all available evidence. This evidence includes historical taxable income, projected future taxable income, the expected timing of the reversal of existing temporary differences and the implementation of tax planning strategies. Projected future taxable income is based on expected results and assumptions as to the jurisdiction in which the income will be earned. The expected timing of the reversals of existing temporary differences is based on current tax law and the Company’s tax methods of accounting. Unless deferred tax assets are more likely than not to be realized, a valuation allowance is established to reduce the carrying value of the deferred tax asset until such time that realization becomes more likely than not. Increases and decreases in these valuation allowances are included in “Income tax expense” in the Consolidated Statements of Operations.
A reconciliation of the beginning and ending amount of unrecognized tax benefits, including positions impacting only the timing of tax benefits, is as follows:
| 2013 | 2012 | 2011 | ||||||||||
| Beginning balance | $ | 299 | $ | 310 | $ | 285 | ||||||
| Additions based on tax positions related to the current year | 23 | 45 | 24 | |||||||||
| Reductions based on tax positions related to the current year | (10 | ) | (9 | ) | — | |||||||
| Additions for tax positions of prior years | 17 | 1 | 24 | |||||||||
| Reductions for tax positions of prior years | (4 | ) | (27 | ) | (11 | ) | ||||||
| Settlements | — | (21 | ) | (12 | ) | |||||||
| Ending balance | $ | 325 | $ | 299 | $ | 310 | ||||||
| 2015 | 2014 | 2013 | ||||||||||
| Beginning balance | $ | 246 | $ | 325 | $ | 299 | ||||||
| Additions based on tax positions related to the current year | 11 | 17 | 23 | |||||||||
| Reductions based on tax positions related to the current year | (11 | ) | (6 | ) | (10 | ) | ||||||
| Additions for tax positions of prior years | 4 | 9 | 17 | |||||||||
| Reductions for tax positions of prior years | (27 | ) | (36 | ) | (4 | ) | ||||||
| Settlements | (17 | ) | (63 | ) | — | |||||||
| Lapse of statute | (2 | ) | — | — | ||||||||
| Ending balance | $ | 204 | $ | 246 | $ | 325 | ||||||
The Company does not anticipate that changes in the amount of unrecognized tax benefits over the next twelve months will have a significant impact on its results of operations or financial position.
As of January 30, 2016, January 31, 2015 and February 1, 2014, February 2, 2013 and January 28, 2012, the amount of unrecognized tax benefits that, if recognized, would impact the effective tax rate was $83, $90 and $98, $70 and $81 respectively.
To the extent interest and penalties would be assessed by taxing authorities on any underpayment of income tax, such amounts have been accrued and classified as a component of income tax expense. During the years ended January 30, 2016, January 31, 2015 and February 1, 2014, February 2, 2013 and January 28, 2012, the Company recognized approximately $10, $(8)$(5), $3 and $(24),$10, respectively, in interest and penalties (recoveries). The Company had accrued approximately $41$25, $30 and $33$41 for the payment of interest and penalties as of January 30, 2016, January 31, 2015 and February 1, 2014, and February 2, 2013, respectively.
As of February 1, 2014,January 31, 2015, the Internal Revenue Service had concluded its field examination of the Company’s 2008our 2010 and 20092011 federal tax returns and is currently auditing tax years 20102012 and 2011.2013. The 20102012 and 20112013 audits are expected to be completed in 2014. The Company has filed an administrative appeal with the Internal Revenue Service protesting certain adjustments proposed by the Internal Revenue Service as a result of their field work.
On September 13, 2013, the U.S. Department of the Treasury and Internal Revenue Service released final tangible property regulations that provide guidance on the tax treatment regarding the deduction and capitalization of expenditures related to tangible property. These regulations are effective for tax years beginning on or after January 1, 2014. The Company is currently assessing these rules and their effect on its financial statements, and believes adoption of these regulations will not have an effect on net income and will not have a material effect on the reclassification between long-term deferred tax liabilities and current income tax liabilities.2016.
A-49
Notes to Consolidated Financial Statements, Continued
6. Debt ObligationsDEBT OBLIGATIONS
Long-term debt consists of:
| 2013 | 2012 | |||||||
| 0.80% to 8.00% Senior notes due through 2043 | $ | 9,083 | $ | 6,587 | ||||
| 5.00% to 12.75% Mortgages due in varying amounts through 2034 | 64 | 60 | ||||||
| 0.27% to 0.45% Commercial paper due through February 2014 | 1,250 | 1,645 | ||||||
| Other | 383 | 184 | ||||||
| Total debt | 10,780 | 8,476 | ||||||
| Less current portion | (1,616 | ) | (2,700 | ) | ||||
| Total long-term debt | $ | 9,164 | $ | 5,776 | ||||
| 2015 | 2014 | |||||||
| 0.76% to 8.00% Senior notes due through 2043 | $ | 9,826 | $ | 9,224 | ||||
| 5.00% to 12.75% Mortgages due in varying amounts through 2027 | 58 | 73 | ||||||
| 0.27% to 0.66% Commercial paper due through February 2016 | 990 | 1,275 | ||||||
| Other | 522 | 454 | ||||||
| Total debt | 11,396 | 11,026 | ||||||
| Less current portion | (2,318 | ) | (1,844 | ) | ||||
| Total long-term debt | $ | 9,078 | $ | 9,182 | ||||
In 2013,2015, the Company issued $600 of senior notes due in fiscal year 2023 bearing an interest rate of 3.85%, $400 of senior notes due in fiscal year 2043 bearing an interest rate of 5.15%, $500 of senior notes due in fiscal year 20162026 bearing an interest rate of 3-month London Inter-Bank Offering Rate plus 53 basis points,3.50%, $300 of senior notes due in fiscal year 20162021 bearing an interest rate of 1.20%, $5002.60% and $300 of senior notes due in fiscal year 2019 bearing an interest rate of 2.30%2.00%, $700and repaid $500 of senior notes bearing an interest rate of 3.90% upon maturity. Due to the merger with Roundy’s, the Company assumed $678 of term loans, which were entirely paid off following the merger.
In 2014, the Company issued $500 of senior notes due in fiscal year 2021 bearing an interest rate of 3.30%2.95% and $500 in senior notes due in fiscal year 2024 bearing an interest rate of 4.00%. In 2013, the Company repaid $400$300 of senior notes bearing an interest rate of 5.00% and $600 of senior notes bearing an interest rate of 7.50%4.95% upon their maturity.
In 2012, the Company issued $500 of senior notes due in fiscal year 2022 bearing an interest rate of 3.40% and $350 of senior notes due in fiscal year 2042 bearing an interest rate of 5.00%. In 2012, the Company repaid upon their maturity $491 of senior notes bearing an interest rate of 6.75%, $346 of senior notes bearing an interest rate of 6.20% and $500 of senior notes bearing an interest rate of 5.50%.
On January 25, 2012,June 30, 2014, the Company amended, extended and extendedrestated its $2,000 unsecured revolving credit facility. The Company entered into the amended credit facility to amend, extend and extendrestate the Company’s existing credit facility whichthat would have terminated on May 15, 2014.January 25, 2017. The amended credit facility provides for a $2,000$2,750 unsecured revolving credit facility (the “Credit Agreement”), with a termination date of January 25, 2017,June 30, 2019, unless extended as permitted under the Credit Agreement. The Company has the ability to increase the size of the Credit Agreement by up to an additional $500,$750, subject to certain conditions.
Borrowings under the Credit Agreement bear interest at the Company’s option, at either (i) LIBOR plus a market rate spread, based on the Company’s Leverage Ratio or (ii) the base rate, defined as the highest of (a) the Federal Funds Rate plus 0.5%, (b) the Bank of America prime rate, (b) the Federal Funds rate plus 0.5%, and (c) one-month LIBOR plus 1.0%, plus a market rate spread based on the Company’s Leverage Ratio. The Company will also pay a Commitment Fee based on the Leverage Ratio and Letter of Credit fees equal to a market rate spread based on the Company’s Leverage Ratio. The Credit Agreement contains covenants, which, among other things, require the maintenance of a Leverage Ratio of not greater than 3.50:1.00 and a Fixed Charge Coverage Ratio of not less than 1.70:1.00. In the first quarter of 2012, the covenants were amended to exclude up to $1,000 in expense related to the Company’s commitment to fund the UFCW consolidated pension plan. The Company may repay the Credit Agreement in whole or in part at any time without premium or penalty. The Credit Agreement is not guaranteed by the Company’s subsidiaries.
In addition to the Credit Agreement, the Company maintained two uncommitted money market lines totaling $75 in the aggregate. The money market lines allow the Company to borrow from banks at mutually agreed upon rates, usually at rates below the rates offered under the credit agreement. As of February 1, 2014,January 30, 2016, the Company had $1,250$990 of borrowings of commercial paper, with a weighted average interest rate of 0.27%0.66%, and no borrowings under its Credit Agreement and money market lines.Agreement. As of February 2, 2013,January 31, 2015, the Company had $1,645$1,275 of borrowings of commercial paper, with a weighted average interest rate of 0.45%0.37%, and no borrowings under its Credit Agreement and money market lines.Agreement.
A-50
Notes to Consolidated Financial Statements, Continued
As of February 1, 2014,January 30, 2016, the Company had outstanding letters of credit in the amount of $209,$244, of which $12$13 reduces funds available under the Company’s Credit Agreement. The letters of credit are maintained primarily to support performance, payment, deposit or surety obligations of the Company.
A-50
Most of the Company’s outstanding public debt is subject to early redemption at varying times and premiums, at the option of the Company. In addition, subject to certain conditions, some of the Company’s publicly issued debt will be subject to redemption, in whole or in part, at the option of the holder upon the occurrence of a redemption event, upon not less than five days’ notice prior to the date of redemption, at a redemption price equal to the default amount, plus a specified premium. “Redemption Event” is defined in the indentures as the occurrence of (i) any person or group, together with any affiliate thereof, beneficially owning 50% or more of the voting power of the Company, (ii) any one person or group, or affiliate thereof, succeeding in having a majority of its nominees elected to the Company’s Board of Directors, in each case, without the consent of a majority of the continuing directors of the Company or (iii) both a change of control and a below investment grade rating.
The aggregate annual maturities and scheduled payments of long-term debt, as of year-end 2013,2015, and for the years subsequent to 20132015 are:
| 2014 | $ | 1,616 | |
| 2015 | 524 | ||
| 2016 | 1,267 | ||
| 2017 | 708 | ||
| 2018 | 1,003 | ||
| Thereafter | 5,662 | ||
| Total debt | $ | 10,780 |
| 2016 | $ | 2,318 | |
| 2017 | 735 | ||
| 2018 | 1,307 | ||
| 2019 | 774 | ||
| 2020 | 724 | ||
| Thereafter | 5,538 | ||
| Total debt | $ | 11,396 |
7. Derivative Financial InstrumentsDERIVATIVE FINANCIAL INSTRUMENTS
GAAP defines derivatives, requires that derivatives be carried at fair value on the balance sheet, and provides for hedge accounting when certain conditions are met. The Company’s derivative financial instruments are recognized on the balance sheet at fair value. Changes in the fair value of derivative instruments designated as “cash flow” hedges, to the extent the hedges are highly effective, are recorded in other comprehensive income, net of tax effects. Ineffective portions of cash flow hedges, if any, are recognized in current period earnings. Other comprehensive income or loss is reclassified into current period earnings when the hedged transaction affects earnings. Changes in the fair value of derivative instruments designated as “fair value” hedges, along with corresponding changes in the fair values of the hedged assets or liabilities, are recorded in current period earnings. Ineffective portions of fair value hedges, if any, are recognized in current period earnings.
The Company assesses, both at the inception of the hedge and on an ongoing basis, whether derivatives used as hedging instruments are highly effective in offsetting the changes in the fair value or cash flow of the hedged items. If it is determined that a derivative is not highly effective as a hedge or ceases to be highly effective, the Company discontinues hedge accounting prospectively.
Interest Rate Risk Management
The Company is exposed to market risk from fluctuations in interest rates. The Company manages its exposure to interest rate fluctuations through the use of a commercial paper program, interest rate swaps (fair value hedges) and forward-starting interest rate swaps (cash flow hedges). The Company’s current program relative to interest rate protection contemplates hedging the exposure to changes in the fair value of fixed-rate debt attributable to changes in interest rates. To do this, the Company uses the following guidelines: (i) use average daily outstanding borrowings to determine annual debt amounts subject to interest rate exposure, (ii) limit the average annual amount subject to interest rate reset and the amount of floating rate debt to a combined total of $2,500 or less, (iii) include no leveraged products, and (iv) hedge without regard to profit motive or sensitivity to current mark-to-market status.
A-51
Notes to Consolidated Financial Statements, Continued
The Company reviews compliance with these guidelines annually with the Financial Policy Committee of the Board of Directors. These guidelines may change as the Company’s needs dictate.
Fair Value Interest Rate Swaps
The table below summarizes the outstanding interest rate swaps designated as fair value hedges as of February 1, 2014January 30, 2016 and February 2, 2013.January 31, 2015.
| 2013 | 2012 | |||||||||||||||||||||||||||
| Pay | Pay | Pay | Pay | 2015 | 2014 | |||||||||||||||||||||||
| Floating | Fixed | Floating | Fixed | Pay Floating | Pay Fixed | Pay Floating | Pay Fixed | |||||||||||||||||||||
| Notional amount | $ | 100 | $ | — | $ | 475 | $ | — | $ | 100 | $— | $ | 100 | $— | ||||||||||||||
| Number of contracts | 2 | — | 6 | — | 2 | — | 2 | — | ||||||||||||||||||||
| Duration in years | 4.94 | — | 1.41 | — | 2.92 | — | 3.94 | — | ||||||||||||||||||||
| Average variable rate | 5.83 | % | — | 3.29 | % | — | 6.00 | % | — | 5.83 | % | — | ||||||||||||||||
| Average fixed rate | 6.80 | % | — | 5.38 | % | — | 6.80 | % | — | 6.80 | % | — | ||||||||||||||||
| Maturity | December 2018 | Between | December 2018 | December 2018 | ||||||||||||||||||||||||
| April 2013 and | ||||||||||||||||||||||||||||
| December 2018 | ||||||||||||||||||||||||||||
During the first quarter of 2013, four of the Company’s fair value swaps, with a notional amount aggregating $375, matured.
The gain or loss on these derivative instruments as well as the offsetting gain or loss on the hedged items attributable to the hedged risk is recognized in current earnings as “Interest expense.” These gains and losses for 20132015 and 20122014 were as follows:
| Year-To-Date | ||||||||
| February 1, 2014 | February 2, 2013 | |||||||
| Consolidated Statement of Operations | Gain/(Loss) on | Gain/(Loss) on | Gain/(Loss) on | Gain/(Loss) on | ||||
| Classification | Swaps | Borrowings | Swaps | Borrowings | ||||
| Interest Expense | $(3) | $4 | $(24) | $16 | ||||
| Year-To-Date | ||||||||
| January 30, 2016 | January 31, 2015 | |||||||
| Consolidated Statements of Operations Classification | Gain/ (Loss) on Swaps | Gain/ (Loss) on Borrowings | Gain/ (Loss) on Swaps | Gain/ (Loss) on Borrowings | ||||
| Interest Expense | $1 | $(1) | $2 | $(2) | ||||
The following table summarizes the location and fair value of derivative instruments designated as fair value hedges on the Company’s Consolidated Balance Sheets:
| Asset Derivatives | ||||||
| Fair Value | ||||||
| February 1, | February 2, | Balance Sheet | ||||
| Derivatives Designated as Fair Value Hedging Instruments | 2014 | 2013 | Location | |||
| Interest Rate Hedges | $(2) | $1 | (Other Long-Term | |||
| Liabilities)/Other | ||||||
| Assets | ||||||
| Asset Derivatives | ||||||
| Fair Value | ||||||
| Derivatives Designated as Fair Value Hedging Instruments | January 30, 2016 | January 31, 2015 | Balance Sheet Location | |||
| Interest Rate Hedges | $1 | $— | (Other long-term | |||
| liabilities)/Other | ||||||
| assets | ||||||
Cash Flow Forward-Starting Interest Rate Swaps
As of February 1, 2014, the Company did not have any outstanding forward-starting interest rate swap agreements.
As of February 2, 2013,January 30, 2016, the Company had 17seven forward-starting interest rate swap agreements with maturity dates between April 2013 and January 2014of August 2017 with an aggregate notional amount totaling $850. In 2012, the Company entered into seven of these forward-starting interest rate swap agreements with an aggregate notional amount totaling $350.$400. A forward-starting interest rate swap is an agreement that effectively hedges the variability in future benchmark interest payments attributable to changes in interest rates on the forecasted issuance of fixed-rate debt. The Company entered into thethese forward-starting interest rate swaps
A-52
Notes to Consolidated Financial Statements, Continued
in order to lock in fixed interest rates on its forecasted issuancesissuance of debt in fiscal year 2013.August 2017. Accordingly, the forward-starting interest rate swaps were designated as cash-flow hedges as defined by GAAP. As of February 2, 2013,January 30, 2016, the fair value of the interest rate swaps was recorded in other assets and other long-term liabilities for $14 and $9, respectively, and AOCI$27 and accumulated other comprehensive loss for $9$17 net of tax and $6 nettax.
A-52
As of tax, respectively.
During 2013,January 31, 2015, the Company terminated 29had four forward-starting interest rate swap agreements with maturity dates of April 2013 and January 2014October 2015 with an aggregate notional amount totaling $1,700. Twelve$300 and seven forward-starting interest rate swap agreements with maturity dates of August 2017 with an aggregate notional amount totaling $400. The Company entered into these forward-starting interest rate swaps in order to lock in fixed interest rates on its forecasted issuances of debt in October 2015 and August 2017. Accordingly, the forward-starting interest rate swaps were designated as cash-flow hedges as defined by GAAP. As of January 31, 2015, the fair value of the interest rate swaps was recorded in other long-term liabilities for $39 and accumulated other comprehensive loss for $25 net of tax.
During 2015, the Company terminated eight forward-starting interest rate swap agreements with maturity dates of October 2015 and January 2016 with an aggregate notional amount totaling $600. Four of these forward-starting interest rate swap agreements, with an aggregate notional amount totaling $850,$300, were entered into and terminated in 2013.2015. These forward-starting interest rate swap agreements were hedging the variability in future benchmark interest payments attributable to changing interest rates on the forecasted issuance of fixed-rate debt issued in 2013.2015. As discussed in Note 6, the Company issued $3,500$1,100 of senior notes in 2013.2015. Since these forward-starting interest rate swap agreements were classified as cash flow hedges, the unamortized loss of $15, $9$17, $11 net of tax, has been deferred net of tax in AOCI and will be amortized to earnings as the interest payments are made.
The following table summarizes the effect of the Company’s derivative instruments designated as cash flow hedges for 20132015 and 2012:2014:
| Year-To-Date | Year-To-Date | |||||||||||||||||||
| Amount of Gain/(Loss) | ||||||||||||||||||||
| Amount of Gain/(Loss) | Reclassified from AOCI | |||||||||||||||||||
| in AOCI on Derivative | into Income (Effective | Location of Gain/(Loss) | ||||||||||||||||||
| Derivatives in Cash Flow Hedging | (Effective Portion) | Portion) | Reclassified into Income | |||||||||||||||||
| Relationships | 2013 | 2012 | 2013 | 2012 | (Effective Portion) | |||||||||||||||
| Derivatives in Cash Flow Hedging Relationships | Amount of Gain/ (Loss) in AOCI on Derivative (Effective Portion) | Amount of Gain/ (Loss) Reclassified from AOCI into Income (Effective Portion) | Location of Gain/ (Loss) Reclassified into Income (Effective Portion) | |||||||||||||||||
| 2015 | 2014 | 2015 | 2014 | |||||||||||||||||
| Forward-Starting Interest Rate | ||||||||||||||||||||
| Swaps, net of tax* | $(25) | $(14) | $(1) | $(3) | Interest expense | $(51) | $(49) | $(1) | $(1) | Interest expense | ||||||||||
| * | The amounts of Gain/(Loss) in AOCI on derivatives include unamortized proceeds and payments from forward-starting interest rate swaps once classified as cash flow hedges that were terminated prior to end of |
For the above fair value and cash flow interest rate swaps, the Company has entered into International Swaps and Derivatives Association master netting agreements that permit the net settlement of amounts owed under their respective derivative contracts. Under these master netting agreements, net settlement generally permits the Company or the counterparty to determine the net amount payable for contracts due on the same date and in the same currency for similar types of derivative transactions. These master netting agreements generally also provide for net settlement of all outstanding contracts with a counterparty in the case of an event of default or a termination event.
Collateral is generally not required of the counterparties or of the Company under these master netting agreements. As of February 1, 2014January 30, 2016 and February 2, 2013,January 31, 2015, no cash collateral was received or pledged under the master netting agreements.
A-53
Notes to Consolidated Financial Statements, Continued
The effect of the net settlement provisions of these master netting agreements on the Company’s derivative balances upon an event of default or termination event is as follows as of February 1, 2014January 30, 2016 and February 2, 2013:January 31, 2015:
| February 1, 2014 | Gross | Net | Gross Amounts Not Offset | |||||||||
| Amounts | Amount | in the Balance Sheet | ||||||||||
| Gross | Offset in | Presented in | ||||||||||
| Amount | the Balance | the Balance | Financial | Cash | Net | |||||||
| Recognized | Sheet | Sheet | Instruments | Collateral | Amount | |||||||
| Liabilities | ||||||||||||
| Fair Value Interest Rate Swaps | $2 | $— | $2 | $— | $— | $2 | ||||||
| January 30, 2016 | Gross Amount Recognized | Gross Amounts Offset in the Balance Sheet | Net Amount Presented in the Balance Sheet | Gross Amounts Not Offset in the Balance Sheet | Net Amount | |||||||
| Financial Instruments | Cash Collateral | |||||||||||
| Assets | ||||||||||||
| Fair Value Interest | ||||||||||||
| Rate Swaps | $1 | $— | $1 | $— | $— | $1 | ||||||
| Liabilities | ||||||||||||
| Cash Flow Forward-Starting | ||||||||||||
| Interest Rate Swaps | 27 | — | 27 | — | — | 27 | ||||||
| February 2, 2013 | Gross | Net | Gross Amounts Not Offset | |||||||||||||||||||||||||||||||||||||||
| Amounts | Amount | in the Balance Sheet | ||||||||||||||||||||||||||||||||||||||||
| Gross | Offset in | Presented in | ||||||||||||||||||||||||||||||||||||||||
| Amount | the Balance | the Balance | Financial | Cash | Net | |||||||||||||||||||||||||||||||||||||
| Recognized | Sheet | Sheet | Instruments | Collateral | Amount | |||||||||||||||||||||||||||||||||||||
| Assets | ||||||||||||||||||||||||||||||||||||||||||
| Cash Flow Forward-Starting | ||||||||||||||||||||||||||||||||||||||||||
| Interest Rate Swaps | $ | 16 | $ | (2 | ) | $ | 14 | $ | — | $ | — | $ | 14 | |||||||||||||||||||||||||||||
| Fair Value Interest Rate Swaps | 1 | — | 1 | — | — | 1 | ||||||||||||||||||||||||||||||||||||
| Total | $ | 17 | $ | (2 | ) | $ | 15 | $ | — | $ | — | $ | 15 | |||||||||||||||||||||||||||||
| January 31, 2015 | Gross Amount Recognized | Gross Amounts Offset in the Balance Sheet | Net Amount Presented inthe Balance Sheet | Gross Amounts Not Offset in the Balance Sheet | Net Amount | |||||||||||||||||||||||||||||||||||||
Financial Instruments | Cash Collateral | |||||||||||||||||||||||||||||||||||||||||
| Liabilities | ||||||||||||||||||||||||||||||||||||||||||
| Cash Flow Forward-Starting | ||||||||||||||||||||||||||||||||||||||||||
| Interest Rate Swaps | $ | 11 | $ | (2 | ) | $ | 9 | $ | — | $ | — | $ | 9 | $39 | $— | $39 | $— | $— | $39 | |||||||||||||||||||||||
Commodity Price Protection
The Company enters into purchase commitments for various resources, including raw materials utilized in its manufacturing facilitiesfood production plants and energy to be used in its stores, warehouses, manufacturing facilitiesfood production plants and administrative offices. The Company enters into commitments expecting to take delivery of and to utilize those resources in the conduct of normal business. Those commitments for which the Company expects to utilize or take delivery in a reasonable amount of time in the normal course of business qualify as normal purchases and normal sales.
8. Fair Value MeasurementsFAIR VALUE MEASUREMENTS
GAAP establishes a fair value hierarchy that prioritizes the inputs used to measure fair value. The three levels of the fair value hierarchy defined in the standards are as follows:
Level 1 – Quoted prices are available in active markets for identical assets or liabilities;
Level 2 – Pricing inputs are other than quoted prices in active markets included in Level 1, which are either directly or indirectly observable;
Level 3 – Unobservable pricing inputs in which little or no market activity exists, therefore requiring an entity to develop its own assumptions about the assumptions that market participants would use in pricing an asset or liability.
A-54
Notes to Consolidated Financial Statements, Continued
For items carried at (or adjusted to) fair value in the consolidated financial statements, the following tables summarize the fair value of these instruments at February 1, 2014January 30, 2016 and February 2, 2013:January 31, 2015:
February 1, 2014January 30, 2016 Fair Value Measurements Using
| Quoted Prices in | Quoted Prices in Active Markets for Identical Assets (Level 1) | Significant Other Observable Inputs (Level 2) | Significant Unobservable Inputs (Level 3) | Total | ||||||||||||||||||||||||||||||
| Active Markets | Significant | |||||||||||||||||||||||||||||||||
| for Identical | Significant Other | Unobservable | ||||||||||||||||||||||||||||||||
| Assets | Observable Inputs | Inputs | ||||||||||||||||||||||||||||||||
| (Level 1) | (Level 2) | (Level 3) | Total | |||||||||||||||||||||||||||||||
| Trading Securities | $48 | $ — | $— | $ 48 | ||||||||||||||||||||||||||||||
| Available-for-Sale Securities | $ | 36 | $ | — | $ | — | $ | 36 | 41 | — | — | 41 | ||||||||||||||||||||||
| Warrants | — | 16 | — | 16 | ||||||||||||||||||||||||||||||
| Long-Lived Assets | — | — | 29 | 29 | — | — | 7 | 7 | ||||||||||||||||||||||||||
| Interest Rate Hedges | — | (2 | ) | — | (2 | ) | — | (26 | ) | — | (26 | ) | ||||||||||||||||||||||
| Total | $ | 36 | $ | 14 | $ | 29 | $ | 79 | $89 | $(26 | ) | $ 7 | $ 70 | |||||||||||||||||||||
February 2, 2013January 31, 2015 Fair Value Measurements Using
| Quoted Prices in | Quoted Prices in Active Markets for Identical Assets (Level 1) | Significant Other Observable Inputs (Level 2) | Significant Unobservable Inputs (Level 3) | Total | ||||||||||||||||||||||||||||||
| Active Markets | Significant | |||||||||||||||||||||||||||||||||
| for Identical | Significant Other | Unobservable | ||||||||||||||||||||||||||||||||
| Assets | Observable Inputs | Inputs | ||||||||||||||||||||||||||||||||
| (Level 1) | (Level 2) | (Level 3) | Total | |||||||||||||||||||||||||||||||
| Trading Securities | $47 | $ — | $— | $ 47 | ||||||||||||||||||||||||||||||
| Available-for-Sale Securities | $ | 8 | $ | — | $ | 20 | $ | 28 | 36 | — | — | 36 | ||||||||||||||||||||||
| Warrants | — | 26 | — | 26 | ||||||||||||||||||||||||||||||
| Long-Lived Assets | — | — | 8 | 8 | — | — | 22 | 22 | ||||||||||||||||||||||||||
| Interest Rate Hedges | — | 6 | — | 6 | — | (39 | ) | — | (39 | ) | ||||||||||||||||||||||||
| Total | $ | 8 | $ | 6 | $ | 28 | $ | 42 | $83 | $(13 | ) | $22 | $ 92 | |||||||||||||||||||||
In 2013, one of the Company’s available-for-sale securities began trading in an active market. Because of this, the Company transferred the $20 fair value of securities from a Level 3 asset to a Level 1 asset in 2013. In 2013,2015 and 2014, unrealized gains on the Level 1 available-for-sale securities totaled $8.$5 and $8, respectively.
The Company values warrants using the Black-Scholes option-pricing model. The Black-Scholes option-pricing model is classified as a Level 2 input.
The Company values interest rate hedges using observable forward yield curves. These forward yield curves are classified as Level 2 inputs.
Fair value measurements of non-financial assets and non-financial liabilities are primarily used in the impairment analysis of goodwill, other intangible assets, long-lived assets and in the valuation of store lease exit costs. The Company reviews goodwill and otherindefinite-lived intangible assets for impairment annually, during the fourth quarter of each fiscal year, and as circumstances indicate the possibility of impairment. See Note 3 for further discussion related to the Company’s carrying value of goodwill. Long-lived assets and store lease exit costs were measured at fair value on a nonrecurring basis using Level 3 inputs as defined in the fair value hierarchy. See Note 1 for further discussion of the Company’s policies and recorded amounts for impairments of long-lived assets and valuation of store lease exit costs. In 2013,2015, long-lived assets with a carrying amount of $68$53 were written down to their fair value of $29,$7, resulting in an impairment charge of $39.$46. In 2012,2014, long-lived assets with a carrying amount of $26$59 were written down to their fair value of $8,$22, resulting in an impairment charge of $18.$37.
A-55
Mergers are accounted for using the acquisition method of accounting, which requires that the purchase price paid for an acquisition be allocated to the assets and liabilities acquired based on their estimated fair values as of the effective date of the acquisition, with the excess of the purchase price over the net assets being recorded as goodwill. See Note 2 for further discussion related to the merger with Harris Teeter.accounting for mergers.
A-55F
Notes to Consolidated Financial Statements, ContinuedAIR VALUEOF OTHER FINANCIAL INSTRUMENTS
Fair Value of Other Financial Instruments
Current and Long-term Debt
The fair value of the Company’s long-term debt, including current maturities, was estimated based on the quoted market prices for the same or similar issues adjusted for illiquidity based on available market evidence. If quoted market prices were not available, the fair value was based upon the net present value of the future cash flow using the forward interest rate yield curve in effect at respective year-ends. At February 1, 2014,January 30, 2016, the fair value of total debt was $11,547$12,344 compared to a carrying value of $10,780.$11,396. At February 2, 2013,January 31, 2015, the fair value of total debt was $9,339$12,378 compared to a carrying value of $8,476.$11,026.
Cash and Temporary Cash Investments, Store Deposits In-Transit, Receivables, Prepaid and Other Current Assets, Trade Accounts Payable, Accrued Salaries and Wages and Other Current Liabilities
The carrying amounts of these items approximated fair value.
Other Assets
The fair values of these investments were estimated based on quoted market prices for those or similar investments, or estimated cash flows, if appropriate. At February 1, 2014January 30, 2016 and February 2, 2013,January 31, 2015, the carrying and fair value of long-term investments for which fair value is determinable were $51was $128 and $44,$133, respectively. At January 30, 2016 and January 31, 2015, the carrying value of notes receivable for which fair value is determinable was $145 and $98, respectively.
9. Other Comprehensive Income (Loss)ACCUMULATED OTHER COMPREHENSIVE INCOME (LOSS)
The following table represents the changes in AOCI by component for the yearyears ended February 1, 2014:January 31, 2015 and January 30, 2016:
| Pension and | ||||||||||||||||||||
| Cash Flow | Available | Postretirement | ||||||||||||||||||
| Hedging | for sale | Defined Benefit | ||||||||||||||||||
| Activities (1) | Securities (1) | Plans (1) | Total (1) | |||||||||||||||||
| Balance at February 2, 2013 | $ | (14 | ) | $ | 7 | $ | (746 | ) | $ | (753 | ) | |||||||||
| OCI before reclassifications (2) | (12 | ) | 5 | 197 | 190 | |||||||||||||||
| Amounts reclassified out of AOCI | 1 | — | 98 | 99 | ||||||||||||||||
| Net current-period OCI | (11 | ) | 5 | 295 | 289 | |||||||||||||||
| Balance at February 1, 2014 | $ | (25 | ) | $ | 12 | $ | (451 | ) | $ | (464 | ) | |||||||||
| Cash Flow Hedging Activities(1) | Available for sale Securities(1) | Pension and Postretirement Defined Benefit Plans(1) | Total(1) | ||||||||||||
| Balance at February 1, 2014 | $ (25 | ) | $12 | $(451 | ) | $(464 | ) | ||||||||
| OCI before reclassifications(2) | (25 | ) | 5 | (351 | ) | (371 | ) | ||||||||
| Amounts reclassified out of AOCI(3) | 1 | — | 22 | 23 | |||||||||||
| Net current-period OCI | (24 | ) | 5 | (329 | ) | (348 | ) | ||||||||
| Balance at January 31, 2015 | (49 | ) | 17 | (780 | ) | (812 | ) | ||||||||
| OCI before reclassifications(2) | (3 | ) | 3 | 78 | 78 | ||||||||||
| Amounts reclassified out of AOCI(3) | 1 | — | 53 | 54 | |||||||||||
| Net current-period OCI | (2 | ) | 3 | 131 | 132 | ||||||||||
| Balance at January 30, 2016 | $ (51 | ) | $20 | $(649 | ) | $(680 | ) | ||||||||
| (1) | All amounts are net of tax. | |||
| (2) | Net of tax of | |||
A-56
| (3) | Net of tax of $13 for pension and postretirement defined benefit plans, as of January 31, 2015. Net of tax of $32 for pension and postretirement defined benefit plans as of January 30, 2016. |
The following table represents the items reclassified out of AOCI and the related tax effects for the yearyears ended January 30, 2016, January 31, 2015 and February 1, 2014:
| February 1, 2014 | For the year ended January 30, 2016 | For the year ended January 31, 2015 | For the year ended February 1, 2014 | ||||||||||||||||||||
| Gains on cash flow hedging activities | |||||||||||||||||||||||
| Amortization of unrealized gains and losses on cash flow hedging activities (1) | $ | 2 | |||||||||||||||||||||
| Amortization of unrealized gains and losses | |||||||||||||||||||||||
| on cash flow hedging activities(1) | $ | 1 | $ | 1 | $ | 2 | |||||||||||||||||
| Tax expense | (1 | ) | — | — | (1 | ) | |||||||||||||||||
| Net of tax | 1 | 1 | 1 | 1 | |||||||||||||||||||
| Pension and postretirement defined benefit plan items | |||||||||||||||||||||||
| Amortization of amounts included in net periodic pension expense (2) | 155 | ||||||||||||||||||||||
| Pension and postretirement defined benefit | |||||||||||||||||||||||
| plan items | |||||||||||||||||||||||
| Amortization of amounts included in net | |||||||||||||||||||||||
| periodic pension expense(2) | 85 | 35 | 98 | ||||||||||||||||||||
| Tax expense | (57 | ) | (32 | ) | (13 | ) | (36 | ) | |||||||||||||||
| Net of tax | 98 | 53 | 22 | 62 | |||||||||||||||||||
| Total reclassifications, net of tax | $ | 99 | $ | 54 | $ | 23 | $ | 63 | |||||||||||||||
| (1) | Reclassified from AOCI into interest expense. |
A-56
Notes to Consolidated Financial Statements, Continued
| (2) | Reclassified from AOCI into merchandise costs and | |
10. Leases and Lease-Financed TransactionsLEASESAND LEASE-FINANCED TRANSACTIONS
While the Company’s current strategy emphasizes ownership of store real estate, the Company operates primarily in leased facilities. Lease terms generally range from 10 to 20 years with options to renew for varying terms. Terms of certain leases include escalation clauses, percentage rent based on sales or payment of executory costs such as property taxes, utilities or insurance and maintenance. Rent expense for leases with escalation clauses or other lease concessions are accounted for on a straight-line basis beginning with the earlier of the lease commencement date or the date the Company takes possession. Portions of certain properties are subleased to others for periods generally ranging from one to 20 years.
Rent expense (under operating leases) consists of:
| 2015 | 2014 | 2013 | ||||||||||||
| Minimum rentals | $ | 807 | $ | 795 | $ | 706 | ||||||||
| Contingent payments | 18 | 16 | 13 | |||||||||||
| Tenant income | (102 | ) | (104 | ) | (106 | ) | ||||||||
| Total rent expense | $ | 723 | $ | 707 | $ | 613 | ||||||||
A-57
| 2013 | 2012 | 2011 | ||||||||||
| Minimum rentals | $ | 706 | $ | 727 | $ | 715 | ||||||
| Contingent payments | 13 | 13 | 13 | |||||||||
| Tenant income | (106 | ) | (112 | ) | (109 | ) | ||||||
| Total rent expense | $ | 613 | $ | 628 | $ | 619 | ||||||
Minimum annual rentals and payments under capital leases and lease-financed transactions for the five years subsequent to 20132015 and in the aggregate are:
| Lease- | Capital Leases | Operating Leases | Lease- Financed Transactions | |||||||||||||||||||||||||||
| Capital | Operating | Financed | ||||||||||||||||||||||||||||
| Leases | Leases | Transactions | ||||||||||||||||||||||||||||
| 2014 | $ | 62 | $ | 832 | $ | 6 | ||||||||||||||||||||||||
| 2015 | 57 | 770 | 7 | |||||||||||||||||||||||||||
| 2016 | 53 | 708 | 7 | $ | 103 | $ | 967 | $ | 7 | |||||||||||||||||||||
| 2017 | 52 | 634 | 8 | 72 | 922 | 7 | ||||||||||||||||||||||||
| 2018 | 43 | 563 | 8 | 62 | 853 | 8 | ||||||||||||||||||||||||
| 2019 | 57 | 774 | 8 | |||||||||||||||||||||||||||
| 2020 | 52 | 674 | 9 | |||||||||||||||||||||||||||
| Thereafter | 349 | 3,101 | 83 | 527 | 4,199 | 63 | ||||||||||||||||||||||||
| 616 | $ | 6,608 | $ | 119 | ||||||||||||||||||||||||||
| Total | $ | 873 | $ | 8,389 | $ | 102 | ||||||||||||||||||||||||
| Less estimated executory costs included in capital leases | — | — | ||||||||||||||||||||||||||||
| Net minimum lease payments under capital leases | 616 | 873 | ||||||||||||||||||||||||||||
| Less amount representing interest | 204 | 293 | ||||||||||||||||||||||||||||
| Present value of net minimum lease payments under capital leases | $ | 412 | ||||||||||||||||||||||||||||
| Present value of net minimum lease payments under | ||||||||||||||||||||||||||||||
| capital leases | $ | 580 | ||||||||||||||||||||||||||||
Total future minimum rentals under noncancellable subleases at February 1, 2014,January 30, 2016 were $217.
A-57
Notes to Consolidated Financial Statements, Continued$261.
11. Earnings Per Common ShareEARNINGSPERCOMMONSHARE
Net earnings attributable to The Kroger Co. per basic common share equals net earnings attributable to The Kroger Co. less income allocated to participating securities divided by the weighted average number of common shares outstanding. Net earnings attributable to The Kroger Co. per diluted common share equals net earnings attributable to The Kroger Co. less income allocated to participating securities divided by the weighted average number of common shares outstanding, after giving effect to dilutive stock options. The following table provides a reconciliation of net earnings attributable to The Kroger Co. and shares used in calculating net earnings attributable to The Kroger Co. per basic common share to those used in calculating net earnings attributable to The Kroger Co. per diluted common share:
| For the year ended | For the year ended | For the year ended | |||||||||||||||||||||||||||||
| February 1, 2014 | February 2, 2013 | January 28, 2012 | |||||||||||||||||||||||||||||
| Earnings | Shares | Per | Earnings | Shares | Per | Earnings | Shares | Per | |||||||||||||||||||||||
| (in millions, except | (Numer- | (Denomi- | Share | (Numer- | (Denomi- | Share | (Numer- | (Denomi- | Share | ||||||||||||||||||||||
| per share amounts) | ator) | nator) | Amount | ator) | nator) | Amount | ator) | nator) | Amount | ||||||||||||||||||||||
| Net earnings attributable | |||||||||||||||||||||||||||||||
| to The Kroger Co. | |||||||||||||||||||||||||||||||
| per basic | |||||||||||||||||||||||||||||||
| common share | $ | 1,507 | 514 | $ | 2.93 | $ | 1,485 | 533 | $ | 2.78 | $ | 598 | 590 | $ | 1.01 | ||||||||||||||||
| Dilutive effect of | |||||||||||||||||||||||||||||||
| stock options | 6 | 4 | 3 | ||||||||||||||||||||||||||||
| Net earnings attributable | |||||||||||||||||||||||||||||||
| to The Kroger Co. | |||||||||||||||||||||||||||||||
| per diluted | |||||||||||||||||||||||||||||||
| common share | $ | 1,507 | 520 | $ | 2.90 | $ | 1,485 | 537 | $ | 2.77 | $ | 598 | 593 | $ | 1.01 | ||||||||||||||||
| For the year ended | For the year ended | For the year ended | ||||||||||||||||||||||
| January 30, 2016 | January 31, 2015 | February 1, 2014 | ||||||||||||||||||||||
| Earnings | Shares | Per | Earnings | Shares | Per | Earnings | Shares | Per | ||||||||||||||||
| (in millions, except | (Numer- | (Denomi- | Share | (Numer- | (Denomi- | Share | (Numer- | (Denomi- | Share | |||||||||||||||
| per share amounts) | ator) | nator) | Amount | ator) | nator) | Amount | ator) | nator) | Amount | |||||||||||||||
| Net earnings attributable to The Kroger Co. per basic common share | $2,021 | 966 | $2.09 | $1,711 | 981 | $1.74 | $1,507 | 1,028 | $1.47 | |||||||||||||||
| Dilutive effect of stock options | 14 | 12 | 12 | |||||||||||||||||||||
| Net earnings attributable to The Kroger Co. per diluted common share | $2,021 | 980 | $2.06 | $1,711 | 993 | $1.72 | $1,507 | 1,040 | $1.45 | |||||||||||||||
The Company had combined undistributed and distributed earnings to participating securities totaling $18, $17 and $12 $12in 2015, 2014 and $4 in 2013, 2012 and 2011, respectively.
For the years ended February 1, 2014, February 2, 2013 and January 28, 2012, there wereA-58
The Company had options outstanding for approximately 2.31.9 million, 12.24.6 million and 12.24.7 million, common shares, respectively, for the years ended January 30, 2016, January 31, 2015 and February 1, 2014, which were excluded from the computationcomputations of net earnings attributable to The Kroger Co. per diluted common share. These shares were excludedshare because their inclusion would have had an anti-dilutive effect on EPS.net earnings per diluted share.
12. Stock Option PlansSTOCK OPTION PLANS
The Company grants options for common shares (“stock options”) to employees under various plans at an option price equal to the fair market value of the stock at the date of grant. The Company accounts for stock options under the fair value recognition provisions. provisions.Under this method, the Company recognizes compensation expense for all share-based payments granted. The Company recognizes share-based compensation expense, net of an estimated forfeiture rate, over the requisite service period of the award. Equity awards may be made at one of four meetings of its Board of Directors occurring shortly after the Company’s release of quarterly earnings. The 20132015 primary grant was made in conjunction with the June meeting of the Company’s Board of Directors. Certain changes to the stock option compensation strategy were put into effect in 2015, which resulted in a reduction to the number of stock options granted in 2015, compared to 2014 and 2013.
Stock options typically expire 10 years from the date of grant. Stock options vest between one and five years from the date of grant. At February 1, 2014,January 30, 2016, approximately 1137 million common shares were available for future option grants under these plans.
In addition to the stock options described above, the Company awards restricted stock to employees as well as toand non-employee directors under various plans. The restrictions on these awards generally lapse between one and five years from the date of the awards. The Company records expense for restricted stock awards in an amount equal to the fair market value of the underlying shares on the grant date of the award, over the period the awards lapse. As of February 1, 2014,January 30, 2016, approximately 521 million common shares were
A-58
Notes to Consolidated Financial Statements, Continued
available under the 2005, 2008, 2011 and 20112014 Long-Term Incentive Plans (the “Plans”) for future restricted stock awards or shares issued to the extent performance criteria are achieved. The Company has the ability to convert shares available for stock options under the Plans to shares available for restricted stock awards. Under some of the Plans, four shares available for option awards can be converted into one share available for restricted stock awards.
All awards become immediately exercisable upon certain changes of control of the Company.
Stock Options
Changes in options outstanding under the stock option plans are summarized below:
| Shares | Weighted- | |||||||||||||||||
| subject | average | |||||||||||||||||
| to option | exercise | |||||||||||||||||
| (in millions) | price | |||||||||||||||||
| Outstanding, year-end 2010 | 35.9 | $ | 21.45 | |||||||||||||||
| Granted | 3.9 | $ | 24.69 | |||||||||||||||
| Exercised | (5.9 | ) | $ | 20.28 | ||||||||||||||
| Canceled or Expired | (2.9 | ) | $ | 24.43 | ||||||||||||||
| Outstanding, year-end 2011 | 31.0 | $ | 21.80 | |||||||||||||||
| Granted | 4.1 | $ | 22.04 | |||||||||||||||
| Exercised | (6.7 | ) | $ | 18.35 | ||||||||||||||
| Canceled or Expired | (1.9 | ) | $ | 23.28 | ||||||||||||||
| Shares subject to option (in millions) | Weighted- average exercise price | |||||||||||||||||
| Outstanding, year-end 2012 | 26.5 | $ | 22.61 | 53.0 | $ | 11.30 | ||||||||||||
| Granted | 4.2 | $ | 37.68 | 8.4 | $ | 18.84 | ||||||||||||
| Exercised | (8.8 | ) | $ | 22.22 | (17.7 | ) | $ | 11.11 | ||||||||||
| Canceled or Expired | (0.2 | ) | $ | 25.47 | (0.4 | ) | $ | 12.74 | ||||||||||
| Outstanding, year-end 2013 | 21.7 | $ | 25.66 | 43.3 | $ | 12.83 | ||||||||||||
| Granted | 8.4 | $ | 24.71 | |||||||||||||||
| Exercised | (10.3 | ) | $ | 11.56 | ||||||||||||||
| Canceled or Expired | (0.6 | ) | $ | 15.56 | ||||||||||||||
| Outstanding, year-end 2014 | 40.8 | $ | 15.56 | |||||||||||||||
| Granted | 3.4 | $ | 38.40 | |||||||||||||||
| Exercised | (8.9 | ) | $ | 13.54 | ||||||||||||||
| Canceled or Expired | (0.4 | ) | $ | 19.98 | ||||||||||||||
| Outstanding, year-end 2015 | 34.9 | $ | 18.26 | |||||||||||||||
A summary of options outstanding and exercisable at February 1, 2014 follows:
| Weighted- | ||||||||||||||
| average | Weighted- | Weighted- | ||||||||||||
| Range of Exercise | Number | remaining | average | Options | average | |||||||||
| Prices | outstanding | contractual life | exercise price | exercisable | exercise price | |||||||||
| (in millions) | (in years) | (in millions) | ||||||||||||
| $13.78 - $18.57 | 2.1 | 0.99 | $16.62 | 2.1 | $16.62 | |||||||||
| $18.58 - $20.97 | 3.6 | 4.80 | $20.09 | 2.9 | $20.06 | |||||||||
| $20.98 - $23.37 | 5.2 | 7.28 | $22.11 | 2.6 | $22.21 | |||||||||
| $23.38 - $28.17 | 3.1 | 7.22 | $24.82 | 1.6 | $24.89 | |||||||||
| $28.18 - $32.97 | 3.6 | 4.01 | $28.51 | 3.5 | $28.44 | |||||||||
| $32.98 - $40.99 | 4.1 | 9.44 | $37.81 | — | $37.76 | |||||||||
| $13.78 - $40.99 | 21.7 | 6.12 | $25.66 | 12.7 | $22.88 | |||||||||
The weighted-average remaining contractual life for options exercisable at February 1, 2014, was approximately 4.5 years. The intrinsic value of options outstanding and exercisable at February 1, 2014 was $233 and $169, respectively.
A-59
NotesA summary of options outstanding, exercisable and expected to Consolidated Financial Statements, Continuedvest at January 30, 2016 follows:
| Number of shares | Weighted- average remaining contractual life | Weighted- average exercise price | Aggregate | |||||
| (in millions) | (in years) | (in millions) | ||||||
| Options Outstanding | 34.9 | 6.20 | $18.26 | 719 | ||||
| Options Exercisable | 21.4 | 5.05 | $14.24 | 526 | ||||
| Options Expected to Vest | 13.2 | 8.02 | $24.53 | 189 |
Restricted stock
Changes in restricted stock outstanding under the restricted stock plans are summarized below:
| Restricted | Restricted shares outstanding (in millions) | Weighted- average grant-date fair value | ||||||||||||||||||
| shares | Weighted-average | |||||||||||||||||||
| outstanding | grant-date | |||||||||||||||||||
| (in millions) | fair value | |||||||||||||||||||
| Outstanding, year-end 2010 | 4.4 | $ | 22.39 | |||||||||||||||||
| Granted | 2.5 | $ | 24.63 | |||||||||||||||||
| Lapsed | (2.5 | ) | $ | 21.96 | ||||||||||||||||
| Canceled or Expired | (0.2 | ) | $ | 23.80 | ||||||||||||||||
| Outstanding, year-end 2011 | 4.2 | $ | 23.92 | |||||||||||||||||
| Granted | 2.6 | $ | 22.23 | |||||||||||||||||
| Lapsed | (2.4 | ) | $ | 24.34 | ||||||||||||||||
| Canceled or Expired | (0.1 | ) | $ | 23.28 | ||||||||||||||||
| Outstanding, year-end 2012 | 4.3 | $ | 22.67 | 8.6 | $ | 11.34 | ||||||||||||||
| Granted | 3.2 | $ | 37.69 | 6.3 | $ | 18.84 | ||||||||||||||
| Lapsed | (2.5 | ) | $ | 22.97 | (5.1 | ) | $ | 11.49 | ||||||||||||
| Canceled or Expired | (0.1 | ) | $ | 27.31 | (0.2 | ) | $ | 13.66 | ||||||||||||
| Outstanding, year-end 2013 | 4.8 | $ | 32.31 | 9.6 | $ | 16.16 | ||||||||||||||
| Granted | 6.1 | $ | 24.76 | |||||||||||||||||
| Lapsed | (5.2 | ) | $ | 16.52 | ||||||||||||||||
| Canceled or Expired | (0.3 | ) | $ | 18.67 | ||||||||||||||||
| Outstanding, year-end 2014 | 10.2 | $ | 21.04 | |||||||||||||||||
| Granted | 3.2 | $ | 38.34 | |||||||||||||||||
| Lapsed | (5.4 | ) | $ | 21.49 | ||||||||||||||||
| Canceled or Expired | (0.4 | ) | $ | 22.80 | ||||||||||||||||
| Outstanding, year-end 2015 | 7.6 | $ | 28.01 | |||||||||||||||||
The weighted-average grant date fair value of stock options granted during 2015, 2014 and 2013 2012was $9.78, $5.98 and 2011 was $8.98, $4.39 and $6.00,$4.49, respectively. The fair value of each stock option grant was estimated on the date of grant using the Black-Scholes option-pricing model, based on the assumptions shown in the table below. The Black-Scholes model utilizes extensiveaccounting judgment and financial estimates, including the term employeesoption holders are expected to retain their stock options before exercising them, the volatility of the Company’s stockshare price over that expected term, the dividend yield over the term and the number of awards expected to be forfeited before they vest. Using alternative assumptions in the calculation of fair value would produce fair values for stock option grants that could be different than those used to record stock-based compensation expense in the Consolidated Statements of Operations. The increase in the fair value of the stock options granted during 2013,2015, compared to 2012,2014, resulted primarily from an increase in the Company’s share price, an increase in the weighted average risk-free interest rate and a decrease inwhich decreased the expected dividend yield. The decreaseincrease in the fair value of the stock options granted during 2012,2014, compared to 2011,2013, resulted primarily from a decreasean increase in the Company’s share price, a decreasewhich decreased the expected dividend yield, and an increase in the weighted average risk-free interest rate and an increase in the expected dividend yield.rate.
A-60
The following table reflects the weighted-average assumptions used for grants awarded to option holders:
| 2013 | 2012 | 2011 | 2015 | 2014 | 2013 | ||||||||||||
| Weighted average expected volatility | 26.34 | % | 26.49 | % | 26.31 | % | 24.07 | % | 25.29 | % | 26.34 | % | |||||
| Weighted average risk-free interest rate | 1.87 | % | 0.97 | % | 2.16 | % | 2.12 | % | 2.06 | % | 1.87 | % | |||||
| Expected dividend yield | 1.82 | % | 2.49 | % | 1.90 | % | 1.20 | % | 1.51 | % | 1.82 | % | |||||
| Expected term (based on historical results) | 6.8 years | 6.9 years | 6.9 years | 7.2 years | 6.6 years | 6.8 years | |||||||||||
The weighted-average risk-free interest rate was based on the yield of a treasury note as of the grant date, continuously compounded, which matures at a date that approximates the expected term of the options. The dividend yield was based on our history and expectation of dividend payouts. Expected volatility was determined based upon historical stock volatilities; however, implied volatility was also considered. Expected term was determined based upon a combination of historical exercise and cancellation experience as well as estimates of expected future exercise and cancellation experience.
A-60
Notes to Consolidated Financial Statements, Continued
Total stock compensation recognized in 2015, 2014 and 2013 2012was $165, $155 and 2011 was $107, $82 and $81, respectively. Stock option compensation recognized in 2015, 2014 and 2013 2012was $31, $32 and 2011 was $24, $22 and $22, respectively. Restricted shares compensation recognized in 2015, 2014 and 2013 2012was $134, $123 and 2011 was $83, $60 and $59, respectively.
The total intrinsic value of options exercised was $217, $142 and $115 $44in 2015, 2014 and $24 in 2013, 2012 and 2011, respectively. The total amount of cash received in 20132015 by the Company from the exercise of options granted under share-based payment arrangements was $196.$120. As of February 1, 2014,January 30, 2016, there was $154$206 of total unrecognized compensation expense remaining related to non-vested share-based compensation arrangements granted under the Company’s equity award plans. This cost is expected to be recognized over a weighted-average period of approximately two years. The total fair value of options that vested was $33, $26 and $20 $23in 2015, 2014 and $33 in 2013, 2012 and 2011, respectively.
Shares issued as a result of stock option exercises may be newly issued shares or reissued treasury shares. Proceeds received from the exercise of options, and the related tax benefit, may be utilized to repurchase the Company’s common shares under a stock repurchase program adopted by the Company’s Board of Directors. During 2013,2015, the Company repurchased approximately eightfive million common shares in such a manner.
13. Commitments and ContingenciesCOMMITMENTSAND CONTINGENCIES
The Company continuously evaluates contingencies based upon the best available evidence.
The Company believes that allowances for loss have been provided to the extent necessary and that its assessment of contingencies is reasonable. To the extent that resolution of contingencies results in amounts that vary from the Company’s estimates, future earnings will be charged or credited.
The principal contingencies are described below:
Insurance — The Company’s workers’ compensation risks are self-insured in most states. In addition, other workers’ compensation risks and certain levels of insured general liability risks are based on retrospective premium plans, deductible plans, and self-insured retention plans. The liability for workers’ compensation risks is accounted for on a present value basis. Actual claim settlements and expenses incident thereto may differ from the provisions for loss. Property risks have been underwritten by a subsidiary and are all reinsured with unrelated insurance companies. Operating divisions and subsidiaries have paid premiums, and the insurance subsidiary has provided loss allowances, based upon actuarially determined estimates.
A-61
Litigation – — Various claims and lawsuits arising in the normal course of business, including suits charging violations of certain antitrust, wage and hour, or civil rights laws, as well as product liability cases, are pending against the Company. Some of these suits purport or have been determined to be class actions and/or seek substantial damages. Any damages that may be awarded in antitrust cases will be automatically trebled. Although it is not possible at this time to evaluate the merits of all of these claims and lawsuits, nor their likelihood of success, the Company is of the belief that any resulting liability will not have a material adverse effect on the Company’s financial position, results of operations, or cash flows.
The Company continually evaluates its exposure to loss contingencies arising from pending or threatened litigation and believes it has made provisions where the loss contingency can beit is reasonably estimatedpossible to estimate and when an adverse outcome is probable. Nonetheless, assessing and predicting the outcomes of these matters involves substantial uncertainties. Management currently believes that the aggregate range of loss for the Company’s exposure is not material to the Company. It remains possible that despite management’s current belief, material differences in actual outcomes or changes in management’s evaluation or predictions could arise that could have a material adverse effect on the Company’s financial condition, results of operations, or cash flows.
Assignments – — The Company is contingently liable for leases that have been assigned to various third parties in connection with facility closings and dispositions. The Company could be required to satisfy the obligations under the leases if any of the assignees is unable to fulfill its lease obligations. Due to the wide distribution of the Company’s assignments among third parties, and various other remedies available, the Company believes the likelihood that it will be required to assume a material amount of these obligations is remote.
A-6114. S
Notes to Consolidated Financial Statements, ContinuedTOCK
14. Stock
Preferred Shares
The Company has authorized five million shares of voting cumulative preferred shares; two million shares were available for issuance at February 1, 2014.January 30, 2016. The shares have a par value of $100 per share and are issuable in series.
Common Shares
The Company has authorized onetwo billion common shares, $1 par value per share.
On May 20, 1999,June 25, 2015, the shareholders authorized an amendment to the Amended Articles of Incorporation to increase the number of authorized common shares from one billion to two billion when theCompany’s Board of Directors determines it to beapproved a two-for-one stock split of The Kroger Co.’s common shares in the best interestform of a 100% stock dividend, which was effective July 13, 2015. All share and per share amounts in the Company.Company’s Consolidated Financial Statements and related notes have been retroactively adjusted to reflect the stock split for all periods presented.
Common Stock Repurchase Program
The Company maintains stock repurchase programs that comply with Rule 10b5-1 of the Securities Exchange Act Rule 10b5-1of 1934 to allow for the orderly repurchase of The Kroger Co. common shares, from time to time. The Company made open market purchases totaling $338, $1,165$500, $1,129 and $1,420$338 under these repurchase programs in 2013, 20122015, 2014 and 2011,2013, respectively. In addition to these repurchase programs, in December 1999, the Company began a program to repurchase common shares to reduce dilution resulting from its employee stock option plans. This program is solely funded by proceeds from stock option exercises and the related tax benefit. The Company repurchased approximately $271, $96$203, $154 and $127$271 under the stock option program during 2015, 2014 and 2013, 2012 and 2011, respectively.
A-62
15. Company-Sponsored Benefit PlansCOMPANY-SPONSORED BENEFIT PLANS
The Company administers non-contributory defined benefit retirement plans for some non-union employees and union-represented employees as determined by the terms and conditions of collective bargaining agreements. These include several qualified pension plans (the “Qualified Plans”) and non-qualified pension plans (the “Non-Qualified Plans”). The Non-Qualified Plans pay benefits to any employee that earns in excess of the maximum allowed for the Qualified Plans by Section 415 of the Internal Revenue Code. The Company only funds obligations under the Qualified Plans. Funding for the Company-sponsored pension plans is based on a review of the specific requirements and on evaluation of the assets and liabilities of each plan.
In addition to providing pension benefits, the Company provides certain health care benefits for retired employees. The majority of the Company’s employees may become eligible for these benefits if they reach normal retirement age while employed by the Company. Funding of retiree health care benefits occurs as claims or premiums are paid.
The Company recognizes the funded status of its retirement plans on the Consolidated Balance Sheet.Sheets. Actuarial gains or losses, prior service costs or credits and transition obligations that have not yet been recognized as part of net periodic benefit cost are required to be recorded as a component of AOCI. All plans are measured as of the Company’s fiscal year end.
Amounts recognized in AOCI as of February 1, 2014January 30, 2016 and February 2, 2013 consistJanuary 31, 2015 consists of the following (pre-tax):
| Pension Benefits | Other Benefits | Total | |||||||||||||||||||||
| 2013 | 2012 | 2013 | 2012 | 2013 | 2012 | ||||||||||||||||||
| Net actuarial loss (gain) | $ | 857 | $ | 1,201 | $ | (111 | ) | $ | (15 | ) | $ | 746 | $ | 1,186 | |||||||||
| Prior service cost (credit) | 2 | 3 | (35 | ) | (8 | ) | (33 | ) | (5 | ) | |||||||||||||
| Total | $ | 859 | $ | 1,204 | $ | (146 | ) | $ | (23 | ) | $ | 713 | $ | 1,181 | |||||||||
| Pension Benefits | Other Benefits | Total | ||||||||||||||||||||||||
| 2015 | 2014 | 2015 | 2014 | 2015 | 2014 | |||||||||||||||||||||
| Net actuarial loss (gain) | $ | 1,213 | $ | 1,398 | $ | (121 | ) | $ | (89 | ) | $ | 1,092 | $ | 1,309 | ||||||||||||
| Prior service cost (credit) | 1 | 1 | (66 | ) | (75 | ) | (65 | ) | (74 | ) | ||||||||||||||||
| Total | $ | 1,214 | $ | 1,399 | $ | (187 | ) | $ | (164 | ) | $ | 1,027 | $ | 1,235 | ||||||||||||
A-62
Notes to Consolidated Financial Statements, Continued
Amounts in AOCI expected to be recognized as components of net periodic pension or postretirement benefit costs in the next fiscal year are as follows (pre-tax):
| Pension | Other | ||||||||||||||||
| Benefits | Benefits | Total | |||||||||||||||
| 2014 | 2014 | 2014 | |||||||||||||||
| Net actuarial loss (gain) | $ | 52 | $ | (6 | ) | $ | 46 | ||||||||||
| Prior service cost (credit) | 1 | (7 | ) | (6 | ) | ||||||||||||
| Total | $ | 53 | $ | (13 | ) | $ | 40 | ||||||||||
| Pension Benefits | Other Benefits | Total | |||||||||||||||
| 2016 | 2016 | 2016 | |||||||||||||||
| Net actuarial loss (gain) | $ | 62 | $ | (9 | ) | $ | 53 | ||||||||||
| Prior service credit | — | (8 | ) | (8 | ) | ||||||||||||
| Total | $ | 62 | $ | (17 | ) | $ | 45 | ||||||||||
Other changes recognized in other comprehensive income in 2013, 20122015, 2014 and 20112013 were as follows (pre-tax):
| Pension Benefits | Other Benefits | Total | ||||||||||||||||||||||||||||||||
| 2013 | 2012 | 2011 | 2013 | 2012 | 2011 | 2013 | 2012 | 2011 | ||||||||||||||||||||||||||
| Incurred net actuarial loss (gain) | $ | (243 | ) | $ | (33 | ) | $ | 451 | $ | (97 | ) | $ | 6 | $ | 32 | $ | (340 | ) | $ | (27 | ) | $ | 483 | |||||||||||
| Amortization of prior service | ||||||||||||||||||||||||||||||||||
| credit (cost) | — | — | (1 | ) | 4 | 4 | 5 | 4 | 4 | 4 | ||||||||||||||||||||||||
| Amortization of net actuarial | ||||||||||||||||||||||||||||||||||
| gain (loss) | (102 | ) | (97 | ) | (64 | ) | — | — | 2 | (102 | ) | (97 | ) | (62 | ) | |||||||||||||||||||
| Other | — | — | — | (30 | ) | — | — | (30 | ) | — | — | |||||||||||||||||||||||
| Total recognized in other | ||||||||||||||||||||||||||||||||||
| comprehensive income | (345 | ) | (130 | ) | 386 | (123 | ) | 10 | 39 | (468 | ) | (120 | ) | 425 | ||||||||||||||||||||
| Total recognized in net periodic | ||||||||||||||||||||||||||||||||||
| benefit cost and other | ||||||||||||||||||||||||||||||||||
| comprehensive income | $ | (271 | ) | $ | (41 | ) | $ | 456 | $ | (95 | ) | $ | 38 | $ | 62 | $ | (366 | ) | $ | (3 | ) | $ | 518 | |||||||||||
| Pension Benefits | Other Benefits | Total | ||||||||||||||||||||||||||||||||||
| 2015 | 2014 | 2013 | 2015 | 2014 | 2013 | 2015 | 2014 | 2013 | ||||||||||||||||||||||||||||
| Incurred net actuarial loss (gain) | $ | (83 | ) | $ | 590 | $ | (243 | ) | $ | (39 | ) | $ | 14 | $ | (97 | ) | $ | (122 | ) | $ | 604 | $ | (340 | ) | ||||||||||||
| Amortization of prior service credit | — | — | — | 11 | 7 | 4 | 11 | 7 | 4 | |||||||||||||||||||||||||||
| Amortization of net actuarial gain (loss) | (102 | ) | (50 | ) | (102 | ) | 7 | 8 | — | (95 | ) | (42 | ) | (102 | ) | |||||||||||||||||||||
| Other | — | — | — | (2 | ) | (47 | ) | (30 | ) | (2 | ) | (47 | ) | (30 | ) | |||||||||||||||||||||
| Total recognized in other | ||||||||||||||||||||||||||||||||||||
| comprehensive income (loss) | (185 | ) | 540 | (345 | ) | (23 | ) | (18 | ) | (123 | ) | (208 | ) | 522 | (468 | ) | ||||||||||||||||||||
| Total recognized in net periodic benefit cost | ||||||||||||||||||||||||||||||||||||
| and other comprehensive income | $ | (82 | ) | $ | 595 | $ | (271 | ) | $ | (22 | ) | $ | (9 | ) | $ | (95 | ) | $ | (104 | ) | $ | 586 | $ | (366 | ) | |||||||||||
A-63
Notes to Consolidated Financial Statements, Continued
Information with respect to change in benefit obligation, change in plan assets, the funded status of the plans recorded in the Consolidated Balance Sheets, net amounts recognized at the end of fiscal years, weighted average assumptions and components of net periodic benefit cost follow:
| Pension Benefits | ||||||||||||||||||||||||||||||||||||||||||||||||||||||||||||
| Pension Benefits | Other | |||||||||||||||||||||||||||||||||||||||||||||||||||||||||||
| Qualified Plans | Non-Qualified Plans | Other Benefits | Qualified Plans | Non-Qualified Plans | Benefits | |||||||||||||||||||||||||||||||||||||||||||||||||||||||
| 2013 | 2012 | 2013 | 2012 | 2013 | 2012 | 2015 | 2014 | 2015 | 2014 | 2015 | 2014 | |||||||||||||||||||||||||||||||||||||||||||||||||
| Change in benefit obligation: | ||||||||||||||||||||||||||||||||||||||||||||||||||||||||||||
| Benefit obligation at beginning of fiscal year | $ | 3,443 | $ | 3,348 | $ | 221 | $ | 217 | $ | 402 | $ | 378 | $ | 4,102 | $ | 3,509 | $ | 304 | $ | 263 | $ | 275 | $ | 294 | ||||||||||||||||||||||||||||||||||||
| Service cost | 40 | 44 | 3 | 3 | 17 | 16 | 62 | 48 | 3 | 3 | 10 | 11 | ||||||||||||||||||||||||||||||||||||||||||||||||
| Interest cost | 144 | 146 | 9 | 9 | 15 | 16 | 154 | 169 | 12 | 13 | 9 | 13 | ||||||||||||||||||||||||||||||||||||||||||||||||
| Plan participants’ contributions | — | — | — | — | 10 | 9 | — | — | — | — | 10 | 11 | ||||||||||||||||||||||||||||||||||||||||||||||||
| Actuarial (gain) loss | (308 | ) | 33 | (20 | ) | 3 | (97 | ) | 6 | (411 | ) | 539 | (17 | ) | 40 | (39 | ) | 14 | ||||||||||||||||||||||||||||||||||||||||||
| Benefits paid | (136 | ) | (131 | ) | (10 | ) | (11 | ) | (25 | ) | (23 | ) | (162 | ) | (163 | ) | (17 | ) | (15 | ) | (19 | ) | (21 | ) | ||||||||||||||||||||||||||||||||||||
| Other | — | 3 | — | — | (30 | ) | — | (17 | ) | — | 3 | — | (2 | ) | (47 | ) | ||||||||||||||||||||||||||||||||||||||||||||
| Assumption of Harris Teeter benefit obligation | 326 | — | 60 | — | 2 | — | ||||||||||||||||||||||||||||||||||||||||||||||||||||||
| Assumption of Roundy’s benefit obligation | 194 | — | 2 | — | — | — | ||||||||||||||||||||||||||||||||||||||||||||||||||||||
| Benefit obligation at end of fiscal year | $ | 3,509 | $ | 3,443 | $ | 263 | $ | 221 | $ | 294 | $ | 402 | $ | 3,922 | $ | 4,102 | $ | 290 | $ | 304 | $ | 244 | $ | 275 | ||||||||||||||||||||||||||||||||||||
| Change in plan assets: | ||||||||||||||||||||||||||||||||||||||||||||||||||||||||||||
| Fair value of plan assets at beginning of | ||||||||||||||||||||||||||||||||||||||||||||||||||||||||||||
| fiscal year | $ | 2,746 | $ | 2,523 | $ | — | $ | — | $ | — | $ | — | $ | 3,189 | $ | 3,135 | $ | — | $ | — | $ | — | $ | — | ||||||||||||||||||||||||||||||||||||
| Actual return on plan assets | 139 | 278 | — | — | — | — | (124 | ) | 217 | — | — | — | — | |||||||||||||||||||||||||||||||||||||||||||||||
| Employer contributions | 100 | 71 | 10 | 11 | 15 | 14 | 5 | — | 17 | 15 | 9 | 10 | ||||||||||||||||||||||||||||||||||||||||||||||||
| Plan participants’ contributions | — | — | — | — | 10 | 9 | — | — | — | — | 10 | 11 | ||||||||||||||||||||||||||||||||||||||||||||||||
| Benefits paid | (136 | ) | (131 | ) | (10 | ) | (11 | ) | (25 | ) | (23 | ) | (162 | ) | (163 | ) | (17 | ) | (15 | ) | (19 | ) | (21 | ) | ||||||||||||||||||||||||||||||||||||
| Other | — | 5 | — | — | — | — | (18 | ) | — | — | — | — | — | |||||||||||||||||||||||||||||||||||||||||||||||
| Assumption of Harris Teeter plan assets | 286 | — | — | — | — | — | ||||||||||||||||||||||||||||||||||||||||||||||||||||||
| Assumption of Roundy’s plan assets | 155 | — | — | — | — | — | ||||||||||||||||||||||||||||||||||||||||||||||||||||||
| Fair value of plan assets at end of fiscal year | $ | 3,135 | $ | 2,746 | $ | — | $ | — | $ | — | $ | — | $ | 3,045 | $ | 3,189 | $ | — | $ | — | $ | — | $ | — | ||||||||||||||||||||||||||||||||||||
| Funded status at end of fiscal year | $ | (374 | ) | $ | (697 | ) | $ | (263 | ) | $ | (221 | ) | $ | (294 | ) | $ | (402 | ) | $ | (877 | ) | $ | (913 | ) | $ | (290 | ) | $ | (304 | ) | $ | (244 | ) | $ | (275 | ) | ||||||||||||||||||||||||
| Net liability recognized at end of fiscal year | $ | (374 | ) | $ | (697 | ) | $ | (263 | ) | $ | (221 | ) | $ | (294 | ) | $ | (402 | ) | $ | (877 | ) | $ | (913 | ) | $ | (290 | ) | $ | (304 | ) | $ | (244 | ) | $ | (275 | ) | ||||||||||||||||||||||||
As of February 1, 2014January 30, 2016 and February 2, 2013,January 31, 2015, other current liabilities include $30$31 and $29, respectively, of net liability recognized for the above benefit plans.
The pension plan assets acquired and liabilities assumed in the Harris Teeter merger did not affect the Company’s net periodic benefit cost in 2013 due to the merger occurring close to year end.
As of February 1, 2014January 30, 2016 and February 2, 2013,January 31, 2015, pension plan assets do not include common shares of The Kroger Co.
| Pension Benefits | Other Benefits | Pension Benefits | Other Benefits | ||||||||||||||||||||||||||||
| Weighted average assumptions | 2013 | 2012 | 2011 | 2013 | 2012 | 2011 | 2015 | 2014 | 2013 | 2015 | 2014 | 2013 | |||||||||||||||||||
| Discount rate – Benefit obligation | 4.99 | % | 4.29 | % | 4.55 | % | 4.68 | % | 4.11 | % | 4.40 | % | 4.62% | 3.87% | 4.99% | 4.44% | 3.74% | 4.68% | |||||||||||||
| Discount rate – Net periodic benefit cost | 4.29 | % | 4.55 | % | 5.60 | % | 4.11 | % | 4.40 | % | 5.40 | % | 3.87% | 4.99% | 4.29% | 3.74% | 4.68% | 4.11% | |||||||||||||
| Expected return on plan assets | 8.50 | % | 8.50 | % | 8.50 | % | |||||||||||||||||||||||||
| Expected long-term rate of return on | |||||||||||||||||||||||||||||||
| plan assets | 7.44% | 7.44% | 8.50% | ||||||||||||||||||||||||||||
| Rate of compensation increase – | |||||||||||||||||||||||||||||||
| Net periodic benefit cost | 2.77 | % | 2.82 | % | 2.88 | % | 2.85% | 2.86% | 2.77% | ||||||||||||||||||||||
| Rate of compensation increase – | |||||||||||||||||||||||||||||||
| Benefit Obligation | 2.86 | % | 2.77 | % | 2.82 | % | |||||||||||||||||||||||||
| Benefit obligation | 2.71% | 2.85% | 2.86% | ||||||||||||||||||||||||||||
A-64
Notes to Consolidated Financial Statements, Continued
The Company’s discount rate assumptions were intended to reflect the rates at which the pension benefits could be effectively settled. They take into account the timing and amount of benefits that would be available under the plans. The Company’s policy for selecting the discount rates as of year-end 2013 and 2012 changed from the policy as of year-end 2011. In 2013 and 2012, the Company’s policy wasis to match the plan’s cash flows to that of a hypothetical bond portfolio whose cash flow from coupons and maturities match the plan’s projected benefit cash flows. The discount rates are the single rates that produce the same present value of cash flows. The selection of the 4.99%4.62% and 4.68%4.44% discount rates as of year-end 20132015 for pension and other benefits, respectively, represents the hypothetical bond portfolio using bonds with an AA or better rating constructed with the assistance of an outside consultant. In 2011, the Company’s policy was to match the plan’s cash flows to that of a yield curve that provides the equivalent yields on zero-coupon corporate bonds for each maturity. Benefit cash flows due in a particular year can theoretically be “settled” by “investing” them in the zero-coupon bond that matures in the same year. The discount rates are the single rates that produce the same present value of cash flows. The selection of the 4.55% and 4.40% discount rates as of year-end 2011 for pension and other benefits, respectively, represents the equivalent single rates constructed under a broad-market AA yield curve constructed with the assistance of an outside consultant. A 100 basis point increase in the discount rate would decrease the projected pension benefit obligation as of February 1, 2014,January 31, 2016, by approximately $395.$438.
To determine the expected rate of return on pension plan assets held by the Company for 2013,2015, the Company considered current and forecasted plan asset allocations as well as historical and forecasted rates of return on various asset categories. Due to the Harris Teeter merger occurring close to year end, the expected rate of return on pension plan assets acquired in the Harris Teeter merger did not affect our net periodic benefit costs in 2013. For 2013, 2012In 2015 and 2011,2014, the Company decreased the assumed a pension plan investment return rate of 8.5%.to 7.44% compared to 8.50% in 2013. The Company pension plan’s average rate of return was 8.1%6.47% for the 10 calendar years ended December 31, 2013,2015, net of all investment management fees and expenses. The value of all investments in the Company-sponsored defined benefit pension plans, excluding pension plan assets acquired in the Harris Teeter merger,Qualified Plans during the calendar year ending December 31, 2013 increased 8.0%2015 decreased 0.80%, net of investment management fees and expenses. For the past 20 years, the Company’s average annual rate of return has been 9.2%7.99%. Based on the above information and forward looking assumptions for investments made in a manner consistent with the Company’s target allocations, the Company believes an 8.5%a 7.44% rate of return assumption was reasonable for 2013, 2012 and 2011.is reasonable.
The Company calculates its expected return on plan assets by using the market-related value of plan assets. The market-related value of plan assets is determined by adjusting the actual fair value of plan assets for gains or losses on plan assets. Gains or losses represent the difference between actual and expected returns on plan investments for each plan year. Gains or losses on plan assets are recognized evenly over a five year period. Using a different method to calculate the market-related value of plan assets would provide a different expected return on plan assets.
On January 31, 2015, the Company adopted new mortality tables based on mortality experience and assumptions for generational mortality improvement in calculating the Company’s 2015 and 2014 Company sponsored benefit plans obligations. The funded status increasedtables assume an improvement in 2013, compared to 2012, due primarily to thelife expectancy and increase in the discount rate, return on plan assetsour current year benefit obligation and contributions to the plan, offset slightly by the update in the mortality assumption.
A-65
Notes to Consolidated Financial Statements, Continued
future net periodic benefit cost. The Company usesused the RP-2000 projected 2021 mortality table in calculating the pension obligation.Company’s 2013 Company sponsored benefit plans obligations and the 2014 and 2013 Company-sponsored net periodic benefit cost.
| Pension Benefits | |||||||||||||||||||||||||||||||||||||||
| Qualified Plans | Non-Qualified Plan | Other Benefits | |||||||||||||||||||||||||||||||||||||
| 2013 | 2012 | 2011 | 2013 | 2012 | 2011 | 2013 | 2012 | 2011 | |||||||||||||||||||||||||||||||
| Components of net periodic benefit cost: | |||||||||||||||||||||||||||||||||||||||
| Service cost | $ | 40 | $ | 44 | $ | 41 | $ | 3 | $ | 3 | $ | 3 | $ | 17 | $ | 16 | $ | 13 | |||||||||||||||||||||
| Interest cost | 144 | 146 | 158 | 9 | 9 | 10 | 15 | 16 | 17 | ||||||||||||||||||||||||||||||
| Expected return on plan assets | (224 | ) | (210 | ) | (207 | ) | — | — | — | — | — | — | |||||||||||||||||||||||||||
| Amortization of: | |||||||||||||||||||||||||||||||||||||||
| Prior service cost (credit) | — | — | — | — | — | 1 | (4 | ) | (4 | ) | (5 | ) | |||||||||||||||||||||||||||
| Actuarial (gain) loss | 93 | 88 | 57 | 9 | 9 | 7 | — | — | (2 | ) | |||||||||||||||||||||||||||||
| Net periodic benefit cost | $ | 53 | $ | 68 | $ | 49 | $ | 21 | $ | 21 | $ | 21 | $ | 28 | $ | 28 | $ | 23 | |||||||||||||||||||||
The funded status increased in 2015, compared to 2014, due primarily to an increase in the discount rate and a decrease in plan assets.
The following table provides the components of the Company’s net periodic benefit costs for 2015, 2014 and 2013:
| Pension Benefits | |||||||||||||||||||||||||||||||||||||||||||||
| Non-Qualified | |||||||||||||||||||||||||||||||||||||||||||||
| Qualified Plans | Plans | Other Benefits | |||||||||||||||||||||||||||||||||||||||||||
| 2015 | 2014 | 2013 | 2015 | 2014 | 2013 | 2015 | 2014 | 2013 | |||||||||||||||||||||||||||||||||||||
| Components of net periodic benefit cost: | |||||||||||||||||||||||||||||||||||||||||||||
| Service cost | $ | 62 | $ | 48 | $ | 40 | $ | 3 | $ | 3 | $ | 3 | $ | 10 | $ | 11 | $ | 17 | |||||||||||||||||||||||||||
| Interest cost | 154 | 169 | 144 | 12 | 13 | 9 | 9 | 13 | 15 | ||||||||||||||||||||||||||||||||||||
| Expected return on plan assets | (230 | ) | (228 | ) | (224 | ) | — | — | — | — | — | — | |||||||||||||||||||||||||||||||||
| Amortization of: | |||||||||||||||||||||||||||||||||||||||||||||
| Prior service credit | — | — | — | — | — | — | (11 | ) | (7 | ) | (4 | ) | |||||||||||||||||||||||||||||||||
| Actuarial (gain) loss | 93 | 46 | 93 | 9 | 4 | 9 | (7 | ) | (8 | ) | — | ||||||||||||||||||||||||||||||||||
| Net periodic benefit cost | $ | 79 | $ | 35 | $ | 53 | $ | 24 | $ | 20 | $ | 21 | $ | 1 | $ | 9 | $ | 28 | |||||||||||||||||||||||||||
A-65
The following table provides the projected benefit obligation (“PBO”), accumulated benefit obligation (“ABO”) and the fair value of plan assets for all Company-sponsored pension plans.
| Qualified Plans | Non-Qualified Plan | ||||||||||||||||
| 2013 | 2012 | 2013 | 2012 | ||||||||||||||
| PBO at end of fiscal year | $ | 3,509 | $ | 3,443 | $ | 263 | $ | 221 | |||||||||
| ABO at end of fiscal year | $ | 3,360 | $ | 3,278 | $ | 256 | $ | 211 | |||||||||
| Fair value of plan assets at end of year | $ | 3,135 | $ | 2,746 | $ | — | $ | — | |||||||||
| Non-Qualified | |||||||||||||||
| Qualified Plans | Plans | ||||||||||||||
| 2015 | 2014 | 2015 | 2014 | ||||||||||||
| PBO at end of fiscal year | $ | 3,922 | $ | 4,102 | $ | 290 | $ | 304 | |||||||
| ABO at end of fiscal year | $ | 3,786 | $ | 3,947 | $ | 280 | $ | 297 | |||||||
| Fair value of plan assets at end of year | $ | 3,045 | $ | 3,189 | $ | — | $ | — | |||||||
The following table provides information about the Company’s estimated future benefit payments.
| Pension | Other | ||||||||||
| Benefits | Benefits | ||||||||||
| 2014 | $ | 201 | $ | 16 | |||||||
| 2015 | $ | 204 | $ | 18 | |||||||
| 2016 | $ | 203 | $ | 19 | |||||||
| 2017 | $ | 211 | $ | 21 | |||||||
| 2018 | $ | 221 | $ | 23 | |||||||
| 2019 – 2023 | $ | 1,232 | $ | 135 | |||||||
| Pension | Other | |||||||||
| Benefits | Benefits | |||||||||
| 2016 | $ | 234 | $ | 15 | ||||||
| 2017 | $ | 221 | $ | 16 | ||||||
| 2018 | $ | 230 | $ | 17 | ||||||
| 2019 | $ | 238 | $ | 18 | ||||||
| 2020 | $ | 248 | $ | 19 | ||||||
| 2021 – 2025 | $ | 1,346 | $ | 105 | ||||||
The following table provides information about the weighted average target and actual pension plan asset allocations.
| Target | Actual | |||||||||||||||||
| allocations | Allocations | Target allocations | Actual Allocations | |||||||||||||||
| 2013 | 2013 | 2012 | 2015 | 2015 | 2014 | |||||||||||||
| Pension plan asset allocation | ||||||||||||||||||
| Global equity securities | 14.6 | % | 15.0 | % | 19.2 | % | 16.0 | % | 14.9 | % | 13.4 | % | ||||||
| Emerging market equity securities | 5.6 | 6.2 | 8.9 | 5.4 | 5.2 | 5.8 | ||||||||||||
| Investment grade debt securities | 11.6 | 10.4 | 8.1 | 13.1 | 11.3 | 11.2 | ||||||||||||
| High yield debt securities | 12.7 | 12.5 | 17.3 | 12.1 | 11.9 | 12.5 | ||||||||||||
| Private equity | 9.1 | 7.7 | 6.0 | 5.2 | 7.4 | 6.6 | ||||||||||||
| Hedge funds | 32.9 | 34.2 | 27.2 | 34.6 | 36.0 | 37.5 | ||||||||||||
| Real estate | 3.3 | 3.3 | 3.3 | 3.4 | 3.9 | 3.5 | ||||||||||||
| Other | 10.2 | 10.7 | 10.0 | 10.2 | 9.4 | 9.5 | ||||||||||||
| Total | 100.0 | % | 100.0 | % | 100.0 | % | 100.0 | % | 100.0 | % | 100.0 | % | ||||||
A-66
Notes to Consolidated Financial Statements, Continued
Investment objectives, policies and strategies are set by the Pension Investment Committees (the “Committees”) appointed by the CEO. The primary objectives include holding and investing the assets and distributing benefits to participants and beneficiaries of the pension plans. Investment objectives have been established based on a comprehensive review of the capital markets and each underlying plan’s current and projected financial requirements. The time horizon of the investment objectives is long-term in nature and plan assets are managed on a going-concern basis.
Investment objectives and guidelines specifically applicable to each manager of assets are established and reviewed annually. Derivative instruments may be used for specified purposes, including rebalancing exposures to certain asset classes. Any use of derivative instruments for a purpose or in a manner not specifically authorized is prohibited, unless approved in advance by the Committees.
A-66
The current target allocations shown represent a combination of the 20132015 targets that were established by the Company in 2012 and allocation targets on assets acquired as part of the merger with Harris Teeter.2014. The Company will rebalance by liquidating assets whose allocation materially exceeds target, if possible, and investing in assets whose allocation is materially below target. If markets are illiquid, the Company may not be able to rebalance to target quickly. To maintain actual asset allocations consistent with target allocations, assets are reallocated or rebalanced periodically. In addition, cash flow from employer contributions and participant benefit payments can be used to fund underweight asset classes and divest overweight asset classes, as appropriate. The Company expects that cash flow will be sufficient to meet most rebalancing needs.
The Company is not required and does not expect to make any contributions to the Company-sponsored defined benefit pension plansQualified Plans in 2014.2016. If the Company does make any contributions in 2014,2016, the Company expects these contributions will decrease its required contributions in future years. Among other things, investment performance of plan assets, the interest rates required to be used to calculate the pension obligations, and future changes in legislation, will determine the amounts of any contributions. The Company expects 20142016 expense for Company-sponsored defined benefit pension plans to be approximately $40.$80. In addition, the Company expects 401(k) Retirement Savings Account Planretirement savings account plans cash contributions and expense from automatic and matching contributions to participants to increasebe approximately $30$200 in 2014 compared to 2013 primarily due to the Harris Teeter merger.2016.
Assumed health care cost trend rates have a significant effect on the amounts reported for the health care plans. The Company used a 7.10%6.90% initial health care cost trend rate, andwhich is assumed to decrease on a linear basis to a 4.50% ultimate health care cost trend rate in 2028, to determine its expense. A one-percentage-point change in the assumed health care cost trend rates would have the following effects:
| 1% Point | 1% Point | ||||||||||||||||
| Increase | Decrease | 1% Point Increase | 1% Point Decrease | ||||||||||||||
| Effect on total of service and interest cost components | $ | 5 | $ | (4 | ) | $ | 3 | $ | (2 | ) | |||||||
| Effect on postretirement benefit obligation | $ | 31 | $ | (26 | ) | $ | 23 | $ | (20 | ) | |||||||
A-67
Notes to Consolidated Financial Statements, Continued
The following table setstables set forth by level, within the fair value hierarchy, the Plan’sQualified Plans’ assets at fair value as of February 1, 2014January 30, 2016 and February 2, 2013:January 31, 2015:
Assets at Fair Value as of February 1, 2014January 30, 2016
Quoted | Significant Other Observable Inputs (Level 2) | Significant Unobservable Inputs (Level 3) | Total | |||||||||||||||
| Cash and cash equivalents | $ | 27 | $ | — | $ | — | $ | 27 | ||||||||||
| Corporate Stocks | 231 | — | — | 231 | ||||||||||||||
| Corporate Bonds | — | 76 | — | 76 | ||||||||||||||
| U.S. Government Securities | — | 75 | — | 75 | ||||||||||||||
| Mutual Funds/Collective Trusts | 89 | 861 | 40 | 990 | ||||||||||||||
| Partnerships/Joint Ventures | — | 118 | — | 118 | ||||||||||||||
| Hedge Funds | — | — | 1,104 | 1,104 | ||||||||||||||
| Private Equity | — | — | 225 | 225 | ||||||||||||||
| Real Estate | — | — | 103 | 103 | ||||||||||||||
| Other | — | 96 | — | 96 | ||||||||||||||
| Total | $ | 347 | $ | 1,226 | $ | 1,472 | $ | 3,045 | ||||||||||
A-67
| Quoted Prices in | Significant | ||||||||||||||||
| Active Markets | Other | Significant | |||||||||||||||
| for Identical | Observable | Unobservable | |||||||||||||||
| Assets | Inputs | Inputs | |||||||||||||||
| (Level 1) | (Level 2) | (Level 3) | Total | ||||||||||||||
| Cash and cash equivalents | $ | 26 | $ | — | $ | — | $ | 26 | |||||||||
| Corporate Stocks | 326 | — | — | 326 | |||||||||||||
| Corporate Bonds | — | 94 | — | 94 | |||||||||||||
| U.S. Government Securities | — | 60 | — | 60 | |||||||||||||
| Mutual Funds/Collective Trusts | 303 | 419 | 39 | 761 | |||||||||||||
| Partnerships/Joint Ventures | — | 317 | — | 317 | |||||||||||||
| Hedge Funds | — | — | 1,073 | 1,073 | |||||||||||||
| Private Equity | — | — | 243 | 243 | |||||||||||||
| Real Estate | — | — | 96 | 96 | |||||||||||||
| Other | — | 139 | — | 139 | |||||||||||||
| Total | $ | 655 | $ | 1,029 | $ | 1,451 | $ | 3,135 | |||||||||
Assets at Fair Value as of February 2, 2013January 31, 2015
| Quoted Prices in | Significant | ||||||||||||||||||||||||||||||||||
| Active Markets | Other | Significant | |||||||||||||||||||||||||||||||||
| for Identical | Observable | Unobservable | |||||||||||||||||||||||||||||||||
| Assets | Inputs | Inputs | |||||||||||||||||||||||||||||||||
| (Level 1) | (Level 2) | (Level 3) | Total | Quoted Prices in Active Markets for Identical Assets (Level 1) | Significant Other Observable Inputs (Level 2) | Significant Unobservable Inputs (Level 3) | Total | ||||||||||||||||||||||||||||
| Cash and cash equivalents | $ | 17 | $ | — | $ | — | $ | 17 | $ | 73 | $ | — | $ | — | $ | 73 | |||||||||||||||||||
| Corporate Stocks | 375 | — | — | 375 | 294 | — | — | 294 | |||||||||||||||||||||||||||
| Corporate Bonds | — | 72 | — | 72 | — | 80 | — | 80 | |||||||||||||||||||||||||||
| U.S. Government Securities | — | 66 | — | 66 | — | 78 | — | 78 | |||||||||||||||||||||||||||
| Mutual Funds/Collective Trusts | 130 | 559 | — | 689 | 123 | 503 | 40 | 666 | |||||||||||||||||||||||||||
| Partnerships/Joint Ventures | — | 378 | — | 378 | — | 468 | — | 468 | |||||||||||||||||||||||||||
| Hedge Funds | — | — | 739 | 739 | — | — | 1,158 | 1,158 | |||||||||||||||||||||||||||
| Private Equity | — | — | 180 | 180 | — | — | 210 | 210 | |||||||||||||||||||||||||||
| Real Estate | — | — | 91 | 91 | — | — | 105 | 105 | |||||||||||||||||||||||||||
| Other | — | 139 | — | 139 | — | 57 | — | 57 | |||||||||||||||||||||||||||
| Total | $ | 522 | $ | 1,214 | $ | 1,010 | $ | 2,746 | $ | 490 | $ | 1,186 | $ | 1,513 | $ | 3,189 | |||||||||||||||||||
A-68
Notes to Consolidated Financial Statements, Continued
For measurements using significant unobservable inputs (Level 3) during 20132015 and 2012,2014, a reconciliation of the beginning and ending balances is as follows:
| Hedge Funds | Private Equity | Real Estate | Collective Trusts | Hedge Funds | Private Equity | Real Estate | Collective Trusts | |||||||||||||||||||||||||||||||||||||||
| Ending balance, January 28, 2012 | $ | 579 | $ | 159 | $ | 81 | $ | — | ||||||||||||||||||||||||||||||||||||||
| Ending balance, February 1, 2014 | $ | 1,073 | $ | 243 | $ | 96 | $ | 39 | ||||||||||||||||||||||||||||||||||||||
| Contributions into Fund | 175 | 49 | 23 | — | 220 | 47 | 17 | — | ||||||||||||||||||||||||||||||||||||||
| Realized gains | 11 | 15 | 3 | — | 47 | 35 | 14 | 1 | ||||||||||||||||||||||||||||||||||||||
| Unrealized gains | 55 | — | 2 | — | ||||||||||||||||||||||||||||||||||||||||||
| Unrealized gains (losses) | 18 | (1 | ) | 4 | — | |||||||||||||||||||||||||||||||||||||||||
| Distributions | (257 | ) | (54 | ) | (25 | ) | — | |||||||||||||||||||||||||||||||||||||||
| Reclass(1) | 58 | (58 | ) | — | — | |||||||||||||||||||||||||||||||||||||||||
| Other | (1 | ) | (2 | ) | (1 | ) | — | |||||||||||||||||||||||||||||||||||||||
| Ending balance, January 31, 2015 | 1,158 | 210 | 105 | 40 | ||||||||||||||||||||||||||||||||||||||||||
| Contributions into Fund | 239 | 47 | 13 | — | ||||||||||||||||||||||||||||||||||||||||||
| Realized gains | 49 | 23 | 9 | — | ||||||||||||||||||||||||||||||||||||||||||
| Unrealized (losses) gains | (49 | ) | (3 | ) | 3 | — | ||||||||||||||||||||||||||||||||||||||||
| Distributions | (81 | ) | (49 | ) | (22 | ) | — | (294 | ) | (50 | ) | (26 | ) | — | ||||||||||||||||||||||||||||||||
| Other | — | 6 | 4 | — | 1 | (2 | ) | (1 | ) | — | ||||||||||||||||||||||||||||||||||||
| Ending balance, February 2, 2013 | 739 | 180 | 91 | — | ||||||||||||||||||||||||||||||||||||||||||
| Contributions into Fund | 297 | 74 | 22 | — | ||||||||||||||||||||||||||||||||||||||||||
| Realized gains | 7 | 12 | 11 | — | ||||||||||||||||||||||||||||||||||||||||||
| Unrealized gains | 71 | 17 | — | — | ||||||||||||||||||||||||||||||||||||||||||
| Distributions | (88 | ) | (47 | ) | (27 | ) | — | |||||||||||||||||||||||||||||||||||||||
| Other | — | 7 | (1 | ) | — | |||||||||||||||||||||||||||||||||||||||||
| Assumption of Harris Teeter plan assets | 47 | — | — | 39 | ||||||||||||||||||||||||||||||||||||||||||
| Ending balance, February 1, 2014 | $ | 1,073 | $ | 243 | $ | 96 | $ | 39 | ||||||||||||||||||||||||||||||||||||||
| Ending balance, January 30, 2016 | $ | 1,104 | $ | 225 | $ | 103 | $ | 40 | ||||||||||||||||||||||||||||||||||||||
| (1) | In 2014, the Company reclassified $58 of Level 3 assets from Private Equity to Hedge Funds. |
See Note 8 for a discussion of the levels of the fair value hierarchy. The assets’ fair value measurement level above is based on the lowest level of any input that is significant to the fair value measurement.
A-68
The following is a description of the valuation methods used for the plan’sQualified Plans’ assets measured at fair value in the above tables:
| ● | Cash and cash equivalents: The carrying value approximates fair value. |
| ● | Corporate Stocks: The fair values of these securities are based on observable market quotations for identical assets and are valued at the closing price reported on the active market on which the individual securities are traded. |
| ● | Corporate Bonds: The fair values of these securities are primarily based on observable market quotations for similar bonds, valued at the closing price reported on the active market on which the individual securities are traded. When such quoted prices are not available, the bonds are valued using a discounted cash flow approach using current yields on similar instruments of issuers with similar credit ratings, including adjustments for certain risks that may not be observable, such as credit and liquidity risks. |
| ● | U.S. Government Securities: Certain U.S. Government securities are valued at the closing price reported in the active market in which the security is traded. Other U.S. government securities are valued based on yields currently available on comparable securities of issuers with similar credit ratings. When quoted prices are not available for similar securities, the security is valued under a discounted cash flow approach that maximizes observable inputs, such as current yields of similar instruments, but includes adjustments for certain risks that may not be observable, such as credit and liquidity risks. |
| ● | Mutual Funds/Collective Trusts: The mutual funds/collective trust funds are public investment vehicles valued using a Net Asset Value (NAV) provided by the manager of each fund. The NAV is based on the underlying net assets owned by the fund, divided by the number of shares outstanding. The NAV’s unit price is quoted on a private market that is not active. However, the NAV is based on the fair value of the underlying securities within the fund, which are traded on an active market, and valued at the closing price reported on the active market on which those individual securities are traded. |
| ● | Partnerships/Joint Ventures: These funds consist primarily of U.S. government securities, Corporate Bonds, Corporate Stocks, and derivatives, which are valued in a manner consistent with these types of investments, noted above. |
| ● | Hedge Funds: Hedge funds are private investment vehicles valued using a Net Asset Value (NAV) provided by the manager of each fund. The NAV is based on the underlying net assets owned by the fund, divided by the number of shares outstanding. The NAV’s unit price is quoted on a private market that is not active. The NAV is based on the fair value of the underlying securities within the funds, which may be traded on an active market, and valued at the closing price reported on the active market on which those individual securities are traded. For investments not traded on an active market, or for which a quoted price is not publicly available, a variety of unobservable valuation methodologies, including discounted cash flow, market multiple and cost valuation approaches, are employed by the fund manager to value investments. Fair values of all investments are adjusted annually, if necessary, based on audits of the Hedge Fund financial statements; such adjustments are reflected in the fair value of the plan’s assets. |
A-69
| ● | Private Equity: Private Equity investments are valued based on the fair value of the underlying securities within the fund, which include investments both traded on an active market and not traded on an active market. For those investments that are traded on an active market, the values are based on the closing price reported on the active market on which those individual securities are traded. For investments not traded on an active market, or for which a quoted price is not publicly available, a variety of unobservable valuation methodologies, including discounted cash flow, market multiple and cost valuation approaches, are employed by the fund manager to value investments. Fair values of all investments are adjusted annually, if necessary, based on audits of the private equity fund financial statements; such adjustments are reflected in the fair value of the plan’s assets. Real Estate: Real estate investments include investments in real estate funds managed by a fund manager. These investments are valued using a variety of unobservable valuation methodologies, including discounted cash flow, market multiple and cost valuation approaches. |
| ● | The methods described above may produce a fair value calculation that may not be indicative of net realizable value or reflective of future fair values. Furthermore, while the Company believes its valuation methods are appropriate and consistent with other market participants, the use of different methodologies or assumptions to determine the fair value of certain financial instruments could result in a different fair value measurement. |
Notes to Consolidated Financial Statements, Continued
The methods described above may produce a fair value calculation that may not be indicative of net realizable value or reflective of future fair values. Furthermore, while the plan believes its valuation methods are appropriate and consistent with other market participants, the use of different methodologies or assumptions to determine the fair value of certain financial instruments could result in a different fair value measurement.
The Company contributed and expensed $148, $140$196, $177 and $130$148 to employee 401(k) retirement savings accounts in 2013, 20122015, 2014 and 2011,2013, respectively. The 401(k) retirement savings account plan providesplans provide to eligible employees both matching contributions and automatic contributions from the Company based on participant contributions, compensation as defined by the plan, and length of service.
The Company also administers other defined contribution plans for eligible employees. The cost of these plans was $5 $7for 2015, 2014 and $6 for 2013, 2012 and 2011, respectively.2013.
16. Multi-Employer Pension Plans
The Company contributes to various multi-employer pension plans, including the UFCW Consolidated Pension Plan, based on obligations arising from collective bargaining agreements. The Company is designated as the named fiduciary of the UFCW Consolidated Pension Plan and has sole investment authority over these assets. These plans provide retirement benefits to participants based on their service to contributing employers. The benefits are paid from assets held in trust for that purpose. Trustees are appointed in equal number by employers and unions. The trustees typically are responsible for determining the level of benefits to be provided to participants as well as for such matters as the investment of the assets and the administration of the plans.
In the fourth quarter of 2011, the Company entered into a memorandum of understanding (“MOU”) with 14 locals of the UFCW that participated in four multi-employer pension funds. The MOU established a process that amended each of the collective bargaining agreements between the Company and the UFCW locals under which the Company made contributions to these funds and consolidated the four multi-employer pension funds into one multi-employer pension fund.
A-70
Notes to Consolidated Financial Statements, Continued
Under the terms of the MOU, the locals of the UFCW agreed to a future pension benefit formula through 2021. The Company was designated as the named fiduciary of the new consolidated pension plan with sole investment authority over the assets. If investment results fail to meet expectations, the Company could be responsible for the shortfall. The Company committed to contribute sufficient funds to cover the actuarial cost of current accruals and to fund the pre-consolidation Unfunded Actuarial Accrued Liability (“UAAL”) that existed as of December 31, 2011, in a series of installments on or before March 31, 2018. At January 1, 2012, the UAAL was estimated to be $911 (pre-tax). In accordance with GAAP, the Company expensed $911 in 2011 related to the UAAL. The expense was based on a preliminary estimate of the contractual commitment. In 2012, the Company finalized the UAAL contractual commitment and recorded an adjustment that reduced the 2011 estimated commitment by $53 (pre-tax). The final UAAL contractual commitment, at January 1, 2012, was $858 (pre-tax). In the fourth quarter of 2011,2015, the Company contributed $650$190 to the consolidated multi-employerUFCW Consolidated Pension Plan. The Company had previously accrued $60 of the total contributions at January 31, 2015 and recorded expense for the remaining $130 at the time of payment in 2015.
In 2014, the Company incurred a charge of $56 (after-tax) related to commitments and withdrawal liabilities associated with the restructuring of pension plan agreements, of which $600$15 was allocatedcontributed to the UAAL and $50 was allocatedUFCW Consolidated Pension Plan in 2014.
Refer to service and interest costs and expensed in 2011. In the fourth quarter of 2012, the Company contributed $258 to the consolidated multi-employer pension plan to fully fund the Company’s UAAL contractual commitment. Future contributions will be dependent, among other things,Note 19 for additional details on the investment performanceeffect of assets in the plan. The funding commitments under the MOU replace the prior commitments under the four existing funds to pay an agreed upon amount per hour worked by eligible employees.certain contributions on quarterly results for 2015 and 2014.
The Company recognizes expense in connection with its multi-employer pension plans as contributions are funded, or in the case of the UFCW consolidated pension plan, when commitments are made. The Company made contributions to thesemulti-employer funds of $426 in 2015, $297 in 2014 and $228 in 2013, $492 in 2012 and $946 in 2011. The cash contributions for 2012 and 2011 include the Company’s $258 and $650 contributions described above, respectively, to the UFCW consolidated pension plan in the fourth quarter of each year.2013.
A-70
The risks of participating in multi-employer pension plans are different from the risks of participating in single-employer pension plans in the following respects:
| a. | Assets contributed to the multi-employer plan by one employer may be used to provide benefits to employees of other participating employers. | |||
| b. | If a participating employer stops contributing to the plan, the unfunded obligations of the plan allocable to such withdrawing employer may be borne by the remaining participating employers. | |||
| c. | If the Company stops participating in some of its multi-employer pension plans, the Company may be required to pay those plans an amount based on its allocable share of the | |||
The Company’s participation in thesemulti-employer plans is outlined in the following tables. The EIN / Pension Plan Number column provides the Employer Identification Number (“EIN”) and the three-digit pension plan number. The most recent Pension Protection Act Zone Status available in 20132015 and 20122014 is for the plan’s year-end at December 31, 20122014 and December 31, 2011,2013, respectively. Among other factors, generally, plans in the red zone are less than 65 percent funded, plans in the yellow zone are less than 80 percent funded and plans in the green zone are at least 80 percent funded. The FIP/RP Status Pending / Implemented Column indicates plans for which a funding improvement plan (“FIP”) or a rehabilitation plan (“RP”) is either pending or has been implemented. Unless otherwise noted, the information for these tables was obtained from the Forms 5500 filed for each plan’s year-end at December 31, 20122014 and December 31, 2011.2013. The multi-employer contributions listed in the table below are the Company’s multi-employer contributions made in fiscal years 2013, 20122015, 2014 and 2011.2013.
A-71
Notes to Consolidated Financial Statements, Continued
The following table contains information about the Company’s multi-employer pension plans:
| Pension | FIP/RP | ||||||||||||||||||
| Protection | Status | Multi-Employer | |||||||||||||||||
| EIN / Pension | Act Zone Status | Pending/ | Contributions | Surcharge | |||||||||||||||
| Pension Fund | Plan Number | 2013 | 2012 | Implemented | 2013 | 2012 | 2011 | Imposed (7) | |||||||||||
| SO CA UFCW Unions & Food | |||||||||||||||||||
| Employers Joint Pension | |||||||||||||||||||
| Trust Fund (1) (2) | 95-1939092 - 001 | Red | Red | Implemented | $ | 45 | $ | 43 | $ | 40 | No | ||||||||
| BD of Trustees of UNTD Food | |||||||||||||||||||
| and Commercial (1) (5) | 58-6101602 - 001 | N/A | Red | N/A | — | — | 59 | No | |||||||||||
| Desert States Employers & UFCW | |||||||||||||||||||
| Unions Pension Plan (1) | 84-6277982 - 001 | Green | Green | No | 23 | 22 | 20 | No | |||||||||||
| UFCW Unions and Food | |||||||||||||||||||
| Employers Pension Plan of | |||||||||||||||||||
| Central Ohio (1) (5) | 31-6089168 - 001 | N/A | Green | N/A | — | — | 23 | No | |||||||||||
| Sound Retirement Trust | |||||||||||||||||||
| (formerly Retail Clerks | |||||||||||||||||||
| Pension Plan) (1) (3) | 91-6069306 – 001 | Red | Red | Implemented | 13 | 12 | 10 | No | |||||||||||
| Rocky Mountain UFCW Unions | |||||||||||||||||||
| and Employers Pension | |||||||||||||||||||
| Plan (1) | 84-6045986 - 001 | Green | Green | No | 17 | 17 | 16 | No | |||||||||||
| Indiana UFCW Unions and | |||||||||||||||||||
| Retail Food Employers | |||||||||||||||||||
| Pension Plan (1) (5) | 35-6244695 - 001 | N/A | Red | N/A | — | — | 5 | No | |||||||||||
| Oregon Retail Employees | |||||||||||||||||||
| Pension Plan (1) | 93-6074377 - 001 | Red | Red | Implemented | 7 | 7 | 6 | No | |||||||||||
| Bakery and Confectionary Union | |||||||||||||||||||
| & Industry International | |||||||||||||||||||
| Pension Fund (1) | 52-6118572 - 001 | Red | Red | Implemented | 12 | 10 | 9 | No | |||||||||||
| Washington Meat Industry | |||||||||||||||||||
| Pension Trust (1) (4) | 91-6134141 - 001 | Red | Red | Implemented | 3 | 3 | 2 | No | |||||||||||
| Retail Food Employers & UFCW | |||||||||||||||||||
| Local 711 Pension (1) | 51-6031512 - 001 | Red | Red | Implemented | 8 | 8 | 7 | No | |||||||||||
| Denver Area Meat Cutters and | |||||||||||||||||||
| Employers Pension Plan (1) | 84-6097461 - 001 | Green | Green | No | 8 | 8 | 8 | No | |||||||||||
| United Food & Commercial | |||||||||||||||||||
| Workers Intl Union – Industry | |||||||||||||||||||
| Pension Fund (1) (4) | 51-6055922 - 001 | Green | Green | No | 33 | 33 | 33 | No | |||||||||||
| Northwest Ohio UFCW Union | |||||||||||||||||||
| and Employers Joint | |||||||||||||||||||
| Pension Fund (1) (5) | 34-0947187 - 001 | N/A | Green | N/A | — | — | 2 | No | |||||||||||
| Western Conference of | |||||||||||||||||||
| Teamsters Pension Plan | 91-6145047 - 001 | Green | Green | No | 31 | 30 | 31 | No | |||||||||||
| Central States, Southeast & | |||||||||||||||||||
| Southwest Areas | |||||||||||||||||||
| Pension Plan | 36-6044243 - 001 | Red | Red | Implemented | 15 | 12 | 14 | No | |||||||||||
| UFCW Consolidated | |||||||||||||||||||
| Pension Plan (1) (6) | 58-6101602 – 001 | Green | N/A | No | — | 275 | 650 | No | |||||||||||
| Other | 13 | 12 | 11 | ||||||||||||||||
| Total Contributions | $ | 228 | $ | 492 | $ | 946 | |||||||||||||
| Pension | |||||||||||||||||||
| Protection | FIP/RP | ||||||||||||||||||
| Act Zone | Status | Multi-Employer | |||||||||||||||||
| EIN / Pension | Status | Pending/ | Contributions | Surcharge | |||||||||||||||
| Pension Fund | Plan Number | 2015 | 2014 | Implemented | 2015 | 2014 | 2013 | Imposed(6) | |||||||||||
| SO CA UFCW Unions & Food | |||||||||||||||||||
| Employers Joint Pension | |||||||||||||||||||
| Trust Fund(1) (2) | 95-1939092 - 001 | Red | Red | Implemented | $ | 55 | $ | 48 | $ | 45 | No | ||||||||
| Desert States Employers | |||||||||||||||||||
| & UFCW Unions | |||||||||||||||||||
| Pension Plan(1) | 84-6277982 - 001 | Green | Green | No | 18 | 21 | 23 | No | |||||||||||
| Sound Retirement Trust | |||||||||||||||||||
| (formerly Retail Clerks | |||||||||||||||||||
| Pension Plan)(1) (3) | 91-6069306 - 001 | Red | Red | Implemented | 17 | 15 | 13 | No | |||||||||||
| Rocky Mountain UFCW | |||||||||||||||||||
| Unions and Employers | |||||||||||||||||||
| Pension Plan(1) | 84-6045986 - 001 | Green | Green | No | 17 | 17 | 17 | No | |||||||||||
| Oregon Retail Employees | |||||||||||||||||||
| Pension Plan(1) | 93-6074377 - 001 | Green | Red | No | 9 | 7 | 7 | No | |||||||||||
| Bakery and Confectionary Union | |||||||||||||||||||
| & Industry International | |||||||||||||||||||
| Pension Fund(1) | 52-6118572 - 001 | Red | Red | Implemented | 11 | 11 | 12 | No | |||||||||||
| Washington Meat Industry | |||||||||||||||||||
| Pension Trust(1) (4) (5) | 91-6134141 - 001 | Red | Red | Implemented | — | 1 | 3 | No | |||||||||||
| Retail Food Employers & UFCW | |||||||||||||||||||
| Local 711 Pension(1) | 51-6031512 - 001 | Red | Red | Implemented | 9 | 9 | 8 | No | |||||||||||
| Denver Area Meat Cutters | |||||||||||||||||||
| and Employers | |||||||||||||||||||
| Pension Plan(1) | 84-6097461 - 001 | Green | Green | No | 7 | 8 | 8 | No | |||||||||||
| United Food & Commercial | |||||||||||||||||||
| Workers Intl Union – Industry | |||||||||||||||||||
| Pension Fund(1) (4) | 51-6055922 - 001 | Green | Green | No | 35 | 33 | 33 | No | |||||||||||
| Western Conference of | |||||||||||||||||||
| Teamsters Pension Plan | 91-6145047 - 001 | Green | Green | No | 31 | 30 | 31 | No | |||||||||||
| Central States, Southeast | |||||||||||||||||||
| & Southwest Areas | |||||||||||||||||||
| Pension Plan | 36-6044243 - 001 | Red | Red | Implemented | 16 | 15 | 15 | No | |||||||||||
| UFCW Consolidated | |||||||||||||||||||
| Pension Plan(1) | 58-6101602 - 001 | Green | Green | No | 190 | 70 | — | No | |||||||||||
| Other | 11 | 12 | 13 | ||||||||||||||||
| Total Contributions | $ | 426 | $ | 297 | $ | 228 | |||||||||||||
| (1) | The Company’s multi-employer contributions to these respective funds represent more than 5% of the total contributions received by the pension funds. |
A-72
Notes to Consolidated Financial Statements, Continued
| (2) | The information for this fund was obtained from the Form 5500 filed for the plan’s year-end at March 31, | |
| (3) | The information for this fund was obtained from the Form 5500 filed for the plan’s year-end at September 30, | |
| (4) | The information for this fund was obtained from the Form 5500 filed for the plan’s year-end at June 30, | |
A-72
| (5) | As of | |
| (6) |
| |
Under the Pension Protection Act, a surcharge may be imposed when employers make contributions under a collective bargaining agreement that is not in compliance with a rehabilitation plan. As of | ||
The following table describes (a) the expiration date of the Company’s collective bargaining agreements and (b) the expiration date of the Company’s most significant collective bargaining agreements for each of the material multi-employer funds in which the Company participates.
A-73
| Expiration Date | Most Significant Collective | |||||
| of Collective | Bargaining Agreements(1) | |||||
| Bargaining | (not in millions) | |||||
| Pension Fund | Agreements | Count | Expiration | |||
| SO CA UFCW Unions & Food Employers Joint | March 2016 to | March 2016 to | ||||
| Pension Trust Fund | June 2017 | 2 | June 2017 | |||
| March 2016 to | April 2016 to | |||||
| UFCW Consolidated Pension Plan | August 2020 | 8 | August 2020 | |||
| Desert States Employers & UFCW Unions | October 2016 to | |||||
| Pension Plan | June 2018 | 1 | October 2016 | |||
| Sound Retirement Trust (formerly Retail | April 2016 to | May 2016 to | ||||
| Clerks Pension Plan) | January 2018 | 2 | August 2016 | |||
| Rocky Mountain UFCW Unions and | January 2019 to | |||||
| Employers Pension Plan | February 2019 | 1 | January 2019 | |||
| August 2015(2)to | August 2015(2)to | |||||
| Oregon Retail Employees Pension Plan | April 2017 | 3 | June 2016 | |||
| Bakery and Confectionary Union & Industry | June 2016 to July | August 2016 to | ||||
| International Pension Fund | 2018 | 4 | July 2018 | |||
| Retail Food Employers & | April 2017 to | |||||
| UFCW Local 711 Pension | November 2019 | 1 | March 2019 | |||
| Denver Area Meat Cutters and | January 2019 to | |||||
| Employers Pension Plan | February 2019 | 1 | January 2019 | |||
| United Food & Commercial Workers Intl Union – | March 2014(2)to | March 2017 to | ||||
| Industry Pension Fund | April 2019 | 2 | April 2019 | |||
| April 2017 to | July 2017 to | |||||
| Western Conference of Teamsters Pension Plan | September 2020 | 5 | September 2020 | |||
| Central States, Southeast & Southwest | September 2017 to | September 2017 to | ||||
| Areas Pension Plan | November 2018 | 3 | November 2018 | |||
Notes to Consolidated Financial Statements, Continued
| (1) | This column represents the number of significant collective bargaining agreements and their expiration date for each of the Company’s pension funds listed above. For purposes of this table, the “significant collective bargaining agreements” are the largest based on covered employees that, when aggregated, cover the majority of the employees for which we make multi-employer contributions for the referenced pension fund. | |
| (2) | Certain collective bargaining agreements for each of these pension funds are operating under an extension. | |
A-73
Based on the most recent information available to it, the Company believes that the present value of actuarial accrued liabilities in most of these multi-employer plans substantially exceeds the value of the assets held in trust to pay benefits. Moreover, if the Company were to exit certain markets or otherwise cease making contributions to these funds, the Company could trigger a substantial withdrawal liability. Any adjustment for withdrawal liability will be recorded when it is probable that a liability exists and can be reasonably estimated.
The Company also contributes to various other multi-employer benefit plans that provide health and welfare benefits to active and retired participants. Total contributions made by the Company to these other multi-employer benefithealth and welfare plans were approximately $1,192 in 2015, $1,200 in 2014 and $1,100 in 2013, $1,100 in 2012 and $1,000 in 2011.2013.
17. Recently Adopted Accounting Standards
In February 2013,2015, the Financial Accounting Standards Board (“FASB”) amended its standards on comprehensive incomeAccounting Standards Codification 835, “Interest-Imputation of Interest.” The amendment simplifies the presentation of debt issuance costs related to a recognized debt liability by requiring disclosure of information about amounts reclassified out of accumulated other comprehensive income (“AOCI”) by component. Specifically, the amendment requires disclosure of the effect of significant reclassifications out of AOCI on the respective line items in net income in which the item was reclassified if the amount being reclassified is required toit be reclassified to net income in its entiretypresented in the same reporting period. It requires cross reference to other disclosuresbalance sheet as a direct deduction from the carrying amount of that provide additional detail for amounts that are not required to be reclassified in their entirety in the same reporting period.debt liability, consistent with debt discounts. This new disclosureamendment became effective for the Company beginning February 3, 2013,1, 2015, and is beingwas adopted prospectivelyretrospectively in accordance with the standard. See Note 9The adoption of this amendment resulted in amounts previously reported in other assets to now be reported within long-term debt including obligations under capital leases and financing obligations in the Consolidated Balance Sheets. These amounts were not material to the prior year. The adoption of this amendment did not have an effect on the Company’s Consolidated Financial Statements for the Company’s new disclosures related to this amended standard.of Operations.
In December 2011, the FASB amended its standards related to offsetting assets and liabilities. This amendment requires entities to disclose both gross and net information about certain instruments and transactions eligible for offset in the statement of financial position and certain instruments and transactions subject to an agreement similar to a master netting agreement. This information is intended to enable users of the financial statements to understand the effect of these arrangements on the Company’s financial position. The new rules became effective for the Company on February 3, 2013. In January 2013, the FASB further amended this standard to limit its scope to derivatives, repurchase and reverse repurchase agreements, securities borrowings and lending transactions. See Note 7 to the Company’s Consolidated Financial Statements for the Company’s new disclosures related to this amended standard.
18. Recently Issued Accounting Standards
In July 2013,May 2014, the FASB amendedissued Accounting Standards CodificationUpdate (“ASC”ASU”) 740, “Income Taxes.2014-09, “Revenue from Contracts with Customers,” The amendmentwhich provides guidance onfor revenue recognition. The standard’s core principle is that a company will recognize revenue when it transfers promised goods or services to customers in an amount that reflects the financial statement presentationconsideration to which the company expects to be entitled in exchange for those goods or services. Per ASU 2015-14, “Deferral of an unrecognized tax benefit, as either a reduction of a deferred tax asset or as a liability, when a net operating loss carryforward, similar tax loss, or a tax credit carryforward exists. The amendmentEffective Date,” this guidance will be effective for interim and annual periods beginning after December 15, 2013 and may be applied on a retrospective basis.the Company in the first quarter of its fiscal year ending February 2, 2019. Early adoption is permitted.permitted as of the first quarter of the Company’s fiscal year ending February 3, 2018. The Company does not expectis currently in the process of evaluating the effect of adoption of this ASU on the Company’s Consolidated Financial Statements.
In April 2015, the FASB issued ASU 2015-04, “Retirement Benefits (Topic 715): Practical Expedient for the Measurement Date of an Employer’s Defined Benefit Obligation and Plan Assets.” This amendment permits an entity to measure defined benefit plan assets and obligations using the month end that is closest to the entity’s fiscal year end for all plans. This guidance will be effective for the Company in the fiscal year ending January 28, 2017. The implementation of this amendment will not have an effect on the Company’s Consolidated Statements of Operations, and will not have a significant effect on the Company’s Consolidated Balance Sheets.
In April 2015, the FASB issued ASU 2015-07, “Fair Value Measurement (Topic 820): Disclosures for Investments in Certain Entities That Calculate Net Asset Value per Share (or Its Equivalent).” This amendment removes the requirement to categorize within the fair value hierarchy all investments for which fair value is measured using the net asset value per share. This guidance will be effective for the Company in the fiscal year ending January 28, 2017. The implementation of this amendment will have an effect on the Company’s Notes to the Consolidated Financial Statements and will not have an effect on the Company’s Consolidated Statements of Operations or Consolidated Balance Sheets.
A-74
In September 2015, the FASB issued ASU 2015-16, “Business Combinations (Topic 805): Simplifying the Accounting for Measurement-Period Adjustments.” This amendment eliminates the requirement to retrospectively account for adjustments made to provisional amounts recognized in a business combination. This guidance will be effective for the Company in its fiscal year ending January 28, 2017. The implementation of this amendment is not expected to have a significant effect on the Company’s consolidated financial position or results of operations.
A-74
Notes to Consolidated Financial Statements.
In November 2015, the FASB issued ASU 2015-17, “Income Taxes (Topic 740): Balance Sheet Classification of Deferred Taxes.” This amendment requires deferred tax liabilities and assets be classified as noncurrent in a classified statement of financial position. This guidance will be effective for the fiscal year ending January 28, 2017. Early adoption is permitted. The implementation of this amendment will not have an effect on the Company’s Consolidated Statements Continuedof Operations and will not have a significant effect on the Company’s Consolidated Balance Sheets.
In February 2016, the FASB issued ASU 2016-02, “Leases”, which provides guidance for the recognition of lease agreements. The standard’s core principle is that a company will now recognize most leases on its balance sheet as lease liabilities with corresponding right-of-use assets. This guidance will be effective in the first quarter of fiscal year ending February 1, 2020. Early adoption is permitted currently. The adoption of this ASU will result in a significant increase to the Company’s balance sheet for lease liabilities and right-of-use assets, and the Company is currently evaluating the other effects of adoption of this ASU on its Consolidated Financial Statements.
19. Quarterly Data (Unaudited)
The two tables that follow reflect the unaudited results of operations for 20132015 and 2012.2014.
| Quarter | |||||||||||||||||||||||||
| First | Second | Third | Fourth | Total Year | |||||||||||||||||||||
| 2013 | (16 Weeks) | (12 Weeks) | (12 Weeks) | (12 Weeks) | (52 Weeks) | ||||||||||||||||||||
| Sales | $ | 29,997 | $ | 22,686 | $ | 22,470 | $ | 23,222 | $ | 98,375 | |||||||||||||||
| Merchandise costs, including advertising, warehousing, | |||||||||||||||||||||||||
| and transportation, | |||||||||||||||||||||||||
| excluding items shown separately below | 23,817 | 18,059 | 17,866 | 18,397 | 78,138 | ||||||||||||||||||||
| Operating, general, and administrative | 4,593 | 3,506 | 3,537 | 3,558 | 15,196 | ||||||||||||||||||||
| Rent | 189 | 139 | 138 | 147 | 613 | ||||||||||||||||||||
| Depreciation and amortization | 519 | 387 | 395 | 402 | 1,703 | ||||||||||||||||||||
| Operating profit | 879 | 595 | 534 | 718 | 2,725 | ||||||||||||||||||||
| Interest expense | 129 | 99 | 108 | 107 | 443 | ||||||||||||||||||||
| Earnings before income tax expense | 750 | 496 | 426 | 611 | 2,282 | ||||||||||||||||||||
| Income tax expense | 266 | 176 | 125 | 184 | 751 | ||||||||||||||||||||
| Net earnings including noncontrolling interests | 484 | 320 | 301 | 427 | 1,531 | ||||||||||||||||||||
| Net earnings attributable to noncontrolling | |||||||||||||||||||||||||
| interests | 3 | 3 | 2 | 5 | 12 | ||||||||||||||||||||
| Net earnings attributable to The Kroger Co. | $ | 481 | $ | 317 | $ | 299 | $ | 422 | $ | 1,519 | |||||||||||||||
| Net earnings attributable to The Kroger Co. per basic | |||||||||||||||||||||||||
| common share | $ | 0.93 | $ | 0.61 | $ | 0.58 | $ | 0.82 | $ | 2.93 | |||||||||||||||
| Average number of shares used in basic calculation | 514 | 515 | 515 | 511 | 514 | ||||||||||||||||||||
| Net earnings attributable to The Kroger Co. per | |||||||||||||||||||||||||
| diluted common share | $ | 0.92 | $ | 0.60 | $ | 0.57 | $ | 0.81 | $ | 2.90 | |||||||||||||||
| Average number of shares used in diluted | |||||||||||||||||||||||||
| calculation | 520 | 521 | 521 | 517 | 520 | ||||||||||||||||||||
| Dividends declared per common share | $ | 0.150 | $ | 0.150 | $ | 0.165 | $ | 0.165 | $ | 0.630 | |||||||||||||||
| Quarter | ||||||||||||||||||||||||||
| First | Second | Third | Fourth | Total Year | ||||||||||||||||||||||
| 2015 | (16 Weeks) | (12 Weeks) | (12 Weeks) | (12 Weeks) | (52 Weeks) | |||||||||||||||||||||
| Sales | $ | 33,051 | $ | 25,539 | $ | 25,075 | $ | 26,165 | $ | 109,830 | ||||||||||||||||
| Merchandise costs, including advertising, | ||||||||||||||||||||||||||
| warehousing, and transportation, excluding | ||||||||||||||||||||||||||
| items shown separately below | 25,760 | 20,065 | 19,478 | 20,193 | 85,496 | |||||||||||||||||||||
| Operating, general and administrative | 5,354 | 4,068 | 4,169 | 4,355 | 17,946 | |||||||||||||||||||||
| Rent | 215 | 155 | 172 | 181 | 723 | |||||||||||||||||||||
| Depreciation and amortization | 620 | 477 | 484 | 508 | 2,089 | |||||||||||||||||||||
| Operating profit | 1,102 | 774 | 772 | 928 | 3,576 | |||||||||||||||||||||
| Interest expense | 148 | 114 | 107 | 113 | 482 | |||||||||||||||||||||
| Earnings before income tax expense | 954 | 660 | 665 | 815 | 3,094 | |||||||||||||||||||||
| Income tax expense | 330 | 227 | 238 | 250 | 1,045 | |||||||||||||||||||||
| Net earnings including noncontrolling interests | 624 | 433 | 427 | 565 | 2,049 | |||||||||||||||||||||
| Net earnings (loss) attributable to | ||||||||||||||||||||||||||
| noncontrolling interests | 5 | — | (1 | ) | 6 | 10 | ||||||||||||||||||||
| Net earnings attributable to The Kroger Co. | $ | 619 | $ | 433 | $ | 428 | $ | 559 | $ | 2,039 | ||||||||||||||||
| Net earnings attributable to The Kroger Co. per | ||||||||||||||||||||||||||
| basic common share | $ | 0.63 | $ | 0.44 | $ | 0.44 | $ | 0.57 | $ | 2.09 | ||||||||||||||||
| Average number of shares used | ||||||||||||||||||||||||||
| in basic calculation | 969 | 963 | 965 | 966 | 966 | |||||||||||||||||||||
| Net earnings attributable to The Kroger Co. | ||||||||||||||||||||||||||
| per diluted common share | $ | 0.62 | $ | 0.44 | $ | 0.43 | $ | 0.57 | $ | 2.06 | ||||||||||||||||
| Average number of shares used in | ||||||||||||||||||||||||||
| diluted calculation | 983 | 977 | 979 | 980 | 980 | |||||||||||||||||||||
| Dividends declared per common share | $ | 0.093 | $ | 0.105 | $ | 0.105 | $ | 0.105 | $ | 0.408 | ||||||||||||||||
Annual amounts may not sum due to rounding.
Certain revenue transactions previously reported in sales and merchandise costs inIn the Consolidated Statementsthird quarter of Operations are now reported net within sales. Also, certain expense transactions previously reported in operating, general, and administrative in2015, the Consolidated Statements of Operations are now reported within merchandise costs. Prior quarter amounts have been revised or reclassifiedCompany incurred a $80 charge to conformOG&A expenses for contributions to the current year presentation. These amounts were not material to the prior periods.UFCW Consolidated Pension Plan.
A-75
NotesIn the fourth quarter of 2015, the Company incurred a $30 charge to OG&A expenses for contributions to the UFCW Consolidated Financial Statements, ConcludedPension Plan.
| Quarter | Quarter | |||||||||||||||||||||||||||||||||||||||||||||||||
| First | Second | Third | Fourth | Total Year | First | Second | Third | Fourth | Total Year | |||||||||||||||||||||||||||||||||||||||||
| 2012 | (16 Weeks) | (12 Weeks) | (12 Weeks) | (13 Weeks) | (53 Weeks) | |||||||||||||||||||||||||||||||||||||||||||||
| 2014 | (16 Weeks) | (12 Weeks) | (12 Weeks) | (12 Weeks) | (52 Weeks) | |||||||||||||||||||||||||||||||||||||||||||||
| Sales | $ | 29,026 | $ | 21,697 | $ | 21,776 | $ | 24,120 | $ | 96,619 | $ | 32,961 | $ | 25,310 | $ | 24,987 | $ | 25,207 | $ | 108,465 | ||||||||||||||||||||||||||||||
| Merchandise costs, including advertising, | ||||||||||||||||||||||||||||||||||||||||||||||||||
| warehousing, and transportation, | ||||||||||||||||||||||||||||||||||||||||||||||||||
| excluding items shown separately below | 23,056 | 17,249 | 17,352 | 19,069 | 76,726 | |||||||||||||||||||||||||||||||||||||||||||||
| Operating, general, and administrative | 4,464 | 3,391 | 3,305 | 3,689 | 14,849 | |||||||||||||||||||||||||||||||||||||||||||||
| warehousing, and transportation, excluding | ||||||||||||||||||||||||||||||||||||||||||||||||||
| items shown separately below | 26,065 | 20,136 | 19,764 | 19,547 | 85,512 | |||||||||||||||||||||||||||||||||||||||||||||
| Operating, general and administrative | 5,168 | 3,920 | 3,954 | 4,119 | 17,161 | |||||||||||||||||||||||||||||||||||||||||||||
| Rent | 191 | 139 | 141 | 157 | 628 | 217 | 166 | 162 | 162 | 707 | ||||||||||||||||||||||||||||||||||||||||
| Depreciation and amortization | 501 | 383 | 382 | 386 | 1,652 | 581 | 444 | 456 | 467 | 1,948 | ||||||||||||||||||||||||||||||||||||||||
| Operating profit | 814 | 535 | 596 | 819 | 2,764 | 930 | 644 | 651 | 912 | 3,137 | ||||||||||||||||||||||||||||||||||||||||
| Interest expense | 141 | 106 | 103 | 112 | 462 | 147 | 112 | 114 | 115 | 488 | ||||||||||||||||||||||||||||||||||||||||
| Earnings before income tax expense | 673 | 429 | 493 | 707 | 2,302 | 783 | 532 | 537 | 797 | 2,649 | ||||||||||||||||||||||||||||||||||||||||
| Income tax expense | 232 | 148 | 175 | 239 | 794 | 274 | 182 | 172 | 274 | 902 | ||||||||||||||||||||||||||||||||||||||||
| Net earnings including noncontrolling interests | 441 | 281 | 318 | 468 | 1,508 | 509 | 350 | 365 | 523 | 1,747 | ||||||||||||||||||||||||||||||||||||||||
| Net earnings attributable to noncontrolling interests | 2 | 2 | 1 | 6 | 11 | |||||||||||||||||||||||||||||||||||||||||||||
| Net earnings attributable to | ||||||||||||||||||||||||||||||||||||||||||||||||||
| noncontrolling interests | 8 | 3 | 3 | 5 | 19 | |||||||||||||||||||||||||||||||||||||||||||||
| Net earnings attributable to The Kroger Co. | $ | 439 | $ | 279 | $ | 317 | $ | 462 | $ | 1,497 | $ | 501 | $ | 347 | $ | 362 | $ | 518 | $ | 1,728 | ||||||||||||||||||||||||||||||
| Net earnings attributable to The Kroger Co. | ||||||||||||||||||||||||||||||||||||||||||||||||||
| per basic common share | $ | 0.78 | $ | 0.52 | $ | 0.61 | $ | 0.89 | $ | 2.78 | $ | 0.50 | $ | 0.35 | $ | 0.37 | $ | 0.53 | $ | 1.74 | ||||||||||||||||||||||||||||||
| Average number of shares used in basic calculation | 556 | 538 | 518 | 514 | 533 | |||||||||||||||||||||||||||||||||||||||||||||
| Average number of shares used in | ||||||||||||||||||||||||||||||||||||||||||||||||||
| basic calculation | 1,002 | 970 | 972 | 972 | 981 | |||||||||||||||||||||||||||||||||||||||||||||
| Net earnings attributable to The Kroger Co. | ||||||||||||||||||||||||||||||||||||||||||||||||||
| per diluted common share | $ | 0.78 | $ | 0.51 | $ | 0.60 | $ | 0.88 | $ | 2.77 | $ | 0.49 | $ | 0.35 | $ | 0.36 | $ | 0.52 | $ | 1.72 | ||||||||||||||||||||||||||||||
| Average number of shares used in diluted calculation | 559 | 541 | 522 | 518 | 537 | |||||||||||||||||||||||||||||||||||||||||||||
| Average number of shares used in diluted | ||||||||||||||||||||||||||||||||||||||||||||||||||
| calculation | 1,014 | 982 | 984 | 987 | 993 | |||||||||||||||||||||||||||||||||||||||||||||
| Dividends declared per common share | $ | 0.115 | $ | 0.115 | $ | 0.150 | $ | 0.150 | $ | 0.530 | $ | 0.083 | $ | 0.083 | $ | 0.093 | $ | 0.093 | $ | 0.350 | ||||||||||||||||||||||||||||||
Annual amounts may not sum due to rounding.
In the first quarter of 2014, the Company incurred a $87 charge to OG&A expenses due to commitments and withdrawal liabilities arising from restructuring of certain pension plan agreements to help stabilize associates’ future benefits.
In the third quarter of 2014, the Company incurred a $25 charge to OG&A expenses due to contributions to the Company’s charitable foundation and a $17 benefit to income tax expense due to certain tax items.
In the fourth quarter of 2014, the Company incurred a $60 charge to OG&A expenses due to contributions to the Company’s charitable foundation and a $55 charge to OG&A expenses for contributions to the UFCW Consolidated Pension Plan.
Certain revenue transactions previously reported20. Subsequent Event
In anticipation of future debt refinancing in salesfiscal years 2017 and merchandise costs2018, the Company, in the Consolidated Statementsfirst quarter of Operations are now reported net within sales. Prior2016, entered into additional forward-starting interest rate swap agreements with an aggregate notional amount totaling $1,300. After entering into these additional forward-starting interest rate swaps, the Company has a total of $1,700 notional amount of forward-starting interest rate swaps outstanding. The forward-starting interest rate swaps entered into in the first quarter amounts have been revised or reclassified to conform to the current year presentation. These amountsof 2016 were not material to the prior periods.designated as cash-flow hedges as defined by GAAP.
A-76
SHAREOWNERS: Wells Fargo Shareowner Services, a division of Wells Fargo Bank, N.A., is Registrar and Transfer Agent for Kroger’s Common Shares. For questions concerning payment of dividends, changes of address, etc., individual shareowners should contact:
Shareholder questions and requests for forms available on the Internet should be directed to: www.shareowneronline.com.
FINANCIAL INFORMATION: Call (513) 762-1220 to request printed financial information, including Kroger’s most recent report on Form 10-Q or 10-K, or press release. Written inquiries should be addressed to Shareholder Relations, The Kroger Co., 1014 Vine Street, Cincinnati, Ohio 45202-1100. Information also is available on Kroger’s corporate website at ir.kroger.com.
| ||||
|
|
| ||
| ||||
|
|
| ||
The Kroger Co.• 1014 Vine Street• Cincinnati, Ohio 45202• (513) 762-4000
VOTE BY INTERNET -www.proxyvote.com
Use the Internet to transmit your voting instructions and for electronic delivery of information up until 11:59 P.M. Eastern Time the day before the meeting date. Have your proxy card in hand when you access the web site and follow the instructions to obtain your records and to create an electronic voting instruction form.
ELECTRONIC DELIVERY OF FUTURE PROXY MATERIALS
If you would like to reduce the costs incurred byour companyin mailing proxy materials, you can consent to receiving all future proxy statements, proxy cards and annual reports electronically via e-mail or the Internet. To sign up for electronic delivery, please follow the instructions above to vote using the Internet and, when prompted, indicate that you agree to receive or access proxy materials electronically in future years.
VOTE BY PHONE - 1-800-690-6903
Use any touch-tone telephone to transmit your voting instructions up until 11:59 P.M. Eastern Time the day before the meeting date. Have your proxy card in hand when you call and then follow the instructions.
VOTE BY MAIL
Mark, sign and date your proxy card and return it in the postage-paid envelope we have provided or return it to Vote Processing, c/o Broadridge, 51 Mercedes Way, Edgewood, NY 11717. If you vote your proxy by Internet or by telephone, you do NOT need to mail back your proxy card.
| TO VOTE, MARK BLOCKS BELOW IN BLUE OR BLACK INK AS FOLLOWS: | |
| KEEP THIS PORTION FOR YOUR RECORDS | |
| DETACH AND RETURN THIS PORTION ONLY | |
| THIS PROXY CARD IS VALID ONLY WHEN SIGNED AND DATED. | |
| THE KROGER CO. | |||||||||
| | |||||||||
| The Board of Directors recommends you vote FOR the following: | |||||||||
| 1. | Election of Directors | ||||||||
| Nominees: | For | Against | Abstain | ||||||
| 1a. | |||||||||
| 1b. | Robert D. Beyer | ||||||||
| 1c. | |||||||||
| 1d. | Susan J. Kropf | ||||||||
| 1e. | |||||||||
| 1f. | |||||||||
| 1g. | |||||||||
| 1h. | |||||||||
| 1i. | |||||||||
| 1j. | |||||||||
| 1k. | |||||||||
| The Board of Directors recommends that you vote FOR proposals 2 | For | Against | Abstain | ||||
| 2. | |||||||
| Advisory vote to approve executive compensation. | |||||||
| The Board of Directors recommends that you vote AGAINST proposals 4, 5, 6 and | For | Against | Abstain | ||||
| A shareholder proposal, if properly presented, to publish a report on human rights risks of operations and supply chain. | |||||||
| 5. | A shareholder proposal, if properly presented, to issue a report assessing the environmental impacts of using unrecyclable packaging for private label brands. | ☐ | ☐ | ☐ | |||
| 6. | A shareholder proposal, if properly presented, to issue a report | ||||||
| 7. | A shareholder proposal, if properly presented, to adopt a general payout policy that gives preference to share repurchases (relative to cash dividends) as a method to return capital to shareholders. | ☐ | ☐ | ☐ | |||
| NOTE:Holders of common shares of record at the close of business on April | |||||||
Please sign exactly as your name(s) appear(s) hereon. When signing as attorney, executor, administrator, or other fiduciary, please give full title as such. Joint owners should each sign personally. All holders must sign. If a corporation or partnership, please sign in full corporate or partnership name by authorized officer. | ||||||
| | ||||||
| Signature [PLEASE SIGN WITHIN BOX] | Date | Signature (Joint Owners) | Date | |||
Important Notice Regarding the Availability of Proxy Materials for the Annual Meeting:
The Combined Notice, Proxy Statement, and Annual Report are available atwww.proxyvote.com.
THE KROGER CO.
2016 Annual Meeting of Shareholders
June 26, 201423, 2016 11:00 AM Eastern Time
This proxy is solicited by the Board of Directors
The undersigned hereby appoints each of ROBERT D. BEYER, W. RODNEY McMULLEN, and RONALD L. SARGENT, or if more than one is present and acting then a majority thereof, proxies, with full power of substitution and revocation, to vote the common shares of The Kroger Co. that the undersigned is entitled to vote at the annual meeting of shareholders, and at any adjournment thereof, with all the powers the undersigned would possess if personally present, including authority to vote on the matters shown on the reverse in the manner directed, and upon any other matter that properly may come before the meeting. The undersigned hereby revokes any proxy previously given to vote those shares at the meeting or at any adjournment.
The proxies are directed to vote as specified on the reverse hereof and in their discretion on all other matters coming before the meeting. Except as specified to the contrary on the reverse, the shares represented by this proxy will be voted FOR each nominee listed in Proposal 1, FOR Proposals 2 3, and 4,3, and AGAINST Proposals 4, 5, 6 and 6.7.
If you wish to vote in accordance with the recommendations of the Board of Directors, all you need to do is sign and return this card. The Proxy Committeeabove named proxies cannot vote the shares unless you vote your proxy by Internet or telephone, or sign and return this card.
Only shareholders and persons holding proxies from shareholders may attend the meeting.If you are attending the meeting, pleaseyou must bring either: (1) the notice of the meeting that was separately mailed to you or (2) the top portion of your proxy card, either of which will serve asbe your admission ticket.
YOUR MANAGEMENT DESIRES TO HAVE A LARGE NUMBER OF SHAREHOLDERS REPRESENTED AT THE MEETING, IN PERSON OR BY PROXY. PLEASE VOTE YOUR PROXY ELECTRONICALLY VIA THE INTERNET OR BY TELEPHONE. IF YOU HAVE ELECTED TO RECEIVE PRINTED MATERIALS, YOU MAY SIGN AND DATE THE PROXY AND MAIL IT IN THE SELF-ADDRESSED ENVELOPE PROVIDED. NO POSTAGE IS REQUIRED IF MAILED WITHIN THE UNITED STATES. If you are unable to attend the annual meeting, you may listen to a live webcast of the meeting, which will be accessible through our website, ir.kroger.com, at 11 a.m., eastern time.11:00 AM Eastern Time on June 23, 2016.
Continued and to be signed on reverse side